Estimated Value: $2,245,000 - $2,797,000
4
Beds
5
Baths
5,535
Sq Ft
$461/Sq Ft
Est. Value
About This Home
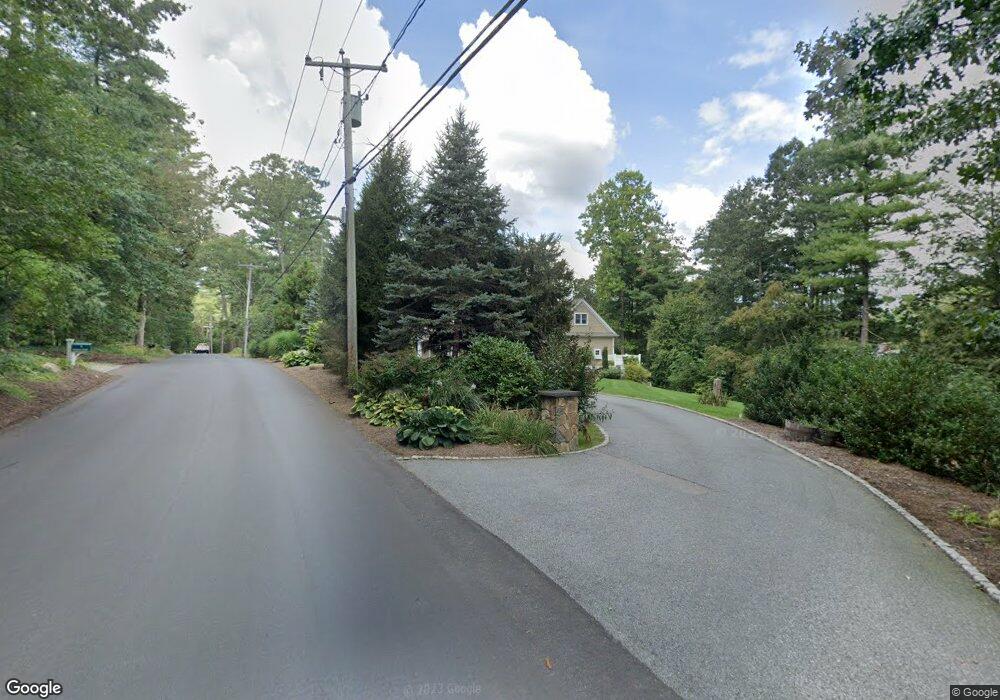
This home is located at 7 Pleasant St, Dover, MA 02030 and is currently estimated at $2,548,932, approximately $460 per square foot. 7 Pleasant St is a home located in Norfolk County with nearby schools including Chickering Elementary School, Dover-Sherborn Regional Middle School, and Dover-Sherborn Regional High School.
Ownership History
Date
Name
Owned For
Owner Type
Purchase Details
Closed on
Aug 19, 2010
Sold by
Figurehead Homes Llc
Bought by
Ban Kevin M and Catallotti Caterina
Current Estimated Value
Home Financials for this Owner
Home Financials are based on the most recent Mortgage that was taken out on this home.
Original Mortgage
$800,000
Outstanding Balance
$531,279
Interest Rate
4.63%
Mortgage Type
Purchase Money Mortgage
Estimated Equity
$2,017,653
Purchase Details
Closed on
Sep 18, 2007
Sold by
Grannis Jerri Z
Bought by
Figurehead Homes Llc
Home Financials for this Owner
Home Financials are based on the most recent Mortgage that was taken out on this home.
Original Mortgage
$1,830,000
Interest Rate
6.7%
Mortgage Type
Purchase Money Mortgage
Create a Home Valuation Report for This Property
The Home Valuation Report is an in-depth analysis detailing your home's value as well as a comparison with similar homes in the area
Home Values in the Area
Average Home Value in this Area
Purchase History
| Date | Buyer | Sale Price | Title Company |
|---|---|---|---|
| Ban Kevin M | $450,000 | -- | |
| Figurehead Homes Llc | $1,380,000 | -- |
Source: Public Records
Mortgage History
| Date | Status | Borrower | Loan Amount |
|---|---|---|---|
| Open | Ban Kevin M | $800,000 | |
| Previous Owner | Figurehead Homes Llc | $1,830,000 |
Source: Public Records
Tax History
| Year | Tax Paid | Tax Assessment Tax Assessment Total Assessment is a certain percentage of the fair market value that is determined by local assessors to be the total taxable value of land and additions on the property. | Land | Improvement |
|---|---|---|---|---|
| 2025 | $26,352 | $2,338,200 | $664,300 | $1,673,900 |
| 2024 | $24,512 | $2,236,500 | $664,300 | $1,572,200 |
| 2023 | $23,039 | $1,890,000 | $522,700 | $1,367,300 |
| 2022 | $21,489 | $1,730,200 | $522,700 | $1,207,500 |
| 2021 | $21,775 | $1,689,300 | $522,700 | $1,166,600 |
| 2020 | $21,691 | $1,689,300 | $522,700 | $1,166,600 |
| 2019 | $21,843 | $1,689,300 | $522,700 | $1,166,600 |
| 2018 | $19,695 | $1,533,900 | $426,900 | $1,107,000 |
| 2017 | $20,080 | $1,538,700 | $413,800 | $1,124,900 |
| 2016 | $19,818 | $1,538,700 | $413,800 | $1,124,900 |
| 2015 | $19,541 | $1,538,700 | $413,800 | $1,124,900 |
Source: Public Records
Map
Nearby Homes
Your Personal Tour Guide
Ask me questions while you tour the home.