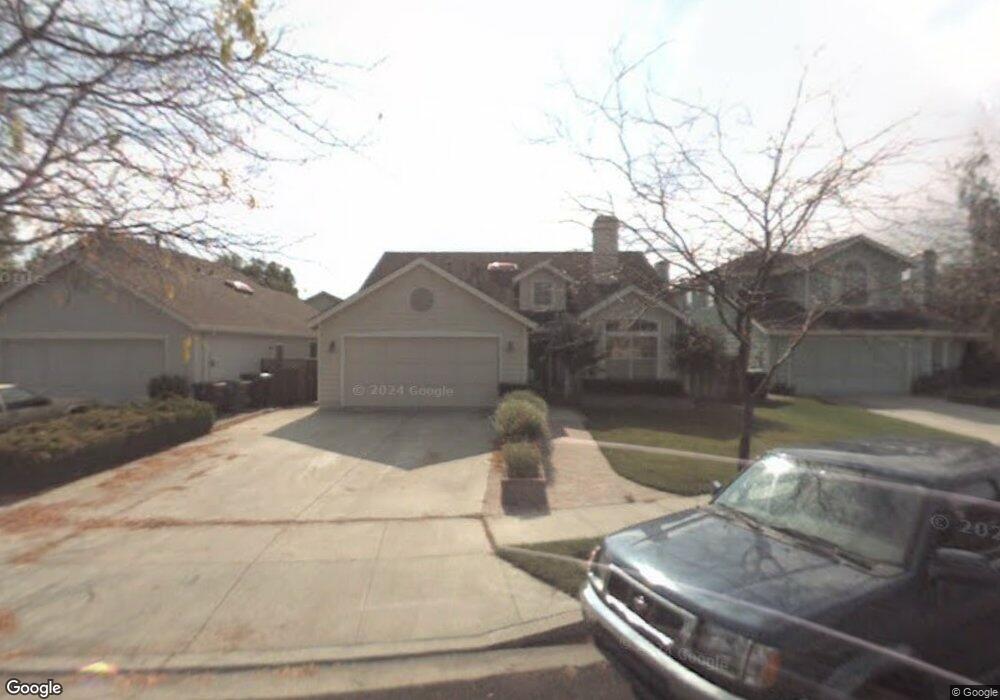
7 Provincetown Cir Salinas, CA 93906
Creekbridge NeighborhoodEstimated Value: $760,842 - $845,000
3
Beds
2
Baths
1,679
Sq Ft
$477/Sq Ft
Est. Value
About This Home
This home is located at 7 Provincetown Cir, Salinas, CA 93906 and is currently estimated at $801,711, approximately $477 per square foot. 7 Provincetown Cir is a home located in Monterey County with nearby schools including John E. Steinbeck Elementary School, Harden Middle School, and Alisal High School.
Ownership History
Date
Name
Owned For
Owner Type
Purchase Details
Closed on
Mar 23, 2021
Sold by
Gams Eric S and Gams Nancy A
Bought by
Gams Eric S and Gams Nancy A
Current Estimated Value
Purchase Details
Closed on
Oct 30, 2002
Sold by
King J Bradley
Bought by
Gams Eric S and Gams Nancy A
Home Financials for this Owner
Home Financials are based on the most recent Mortgage that was taken out on this home.
Original Mortgage
$292,000
Outstanding Balance
$121,676
Interest Rate
5.95%
Estimated Equity
$680,035
Purchase Details
Closed on
Aug 30, 2000
Sold by
King Debi
Bought by
King J Bradley
Home Financials for this Owner
Home Financials are based on the most recent Mortgage that was taken out on this home.
Original Mortgage
$236,000
Interest Rate
8.13%
Create a Home Valuation Report for This Property
The Home Valuation Report is an in-depth analysis detailing your home's value as well as a comparison with similar homes in the area
Home Values in the Area
Average Home Value in this Area
Purchase History
| Date | Buyer | Sale Price | Title Company |
|---|---|---|---|
| Gams Eric S | -- | None Available | |
| Gams Eric S | $365,000 | Old Republic Title Company | |
| King J Bradley | -- | Old Republic Title Company | |
| King J Bradley | $295,000 | Old Republic Title Company |
Source: Public Records
Mortgage History
| Date | Status | Borrower | Loan Amount |
|---|---|---|---|
| Open | Gams Eric S | $292,000 | |
| Previous Owner | King J Bradley | $236,000 | |
| Closed | King J Bradley | $29,250 |
Source: Public Records
Tax History Compared to Growth
Tax History
| Year | Tax Paid | Tax Assessment Tax Assessment Total Assessment is a certain percentage of the fair market value that is determined by local assessors to be the total taxable value of land and additions on the property. | Land | Improvement |
|---|---|---|---|---|
| 2025 | $7,063 | $528,620 | $202,755 | $325,865 |
| 2024 | $7,063 | $518,256 | $198,780 | $319,476 |
| 2023 | $6,949 | $508,095 | $194,883 | $313,212 |
| 2022 | $6,270 | $498,133 | $191,062 | $307,071 |
| 2021 | $6,265 | $488,366 | $187,316 | $301,050 |
| 2020 | $6,191 | $483,360 | $185,396 | $297,964 |
| 2019 | $6,378 | $473,883 | $181,761 | $292,122 |
| 2018 | $6,019 | $464,593 | $178,198 | $286,395 |
| 2017 | $6,081 | $444,000 | $170,000 | $274,000 |
| 2016 | $5,342 | $402,000 | $154,000 | $248,000 |
| 2015 | $5,330 | $399,000 | $153,000 | $246,000 |
| 2014 | $4,612 | $350,000 | $134,000 | $216,000 |
Source: Public Records
Map
Nearby Homes
- 18 Suffield Cir
- 1615 Newport Ct
- 1 Eliot Cir
- 1049 Twin Creeks Dr
- 822 Castleton St
- 734 Los Coches Ave
- 730 Los Coches Ave
- 8 Bristol Cir
- 794 Danbury St
- 1731 Pescadero Dr
- 1513 Oyster Bay Ct
- 7 Massachusetts Cir
- 1204 Pickford Way
- 1780 Truckee Way
- 1392 New Hampshire Ct
- 634 Yreka Dr
- 1920 Constitution Blvd Unit 36
- 383 Natividad Rd
- 607 Calaveras Dr
- 742 Pino Way
- 5 Provincetown Cir
- 9 Provincetown Cir
- 3 Provincetown Cir
- 928 Provincetown Dr
- 930 Provincetown Dr
- 926 Provincetown Dr
- 11 Provincetown Cir
- 934 Provincetown Dr
- 924 Provincetown Dr
- 1 Provincetown Cir
- 6 Provincetown Cir
- 13 Provincetown Cir
- 938 Provincetown Dr
- 4 Provincetown Cir
- 8 Provincetown Cir
- 922 Provincetown Dr
- 2 Provincetown Cir
- 12 Provincetown Cir
- 10 Provincetown Cir
- 898 Lexington Dr