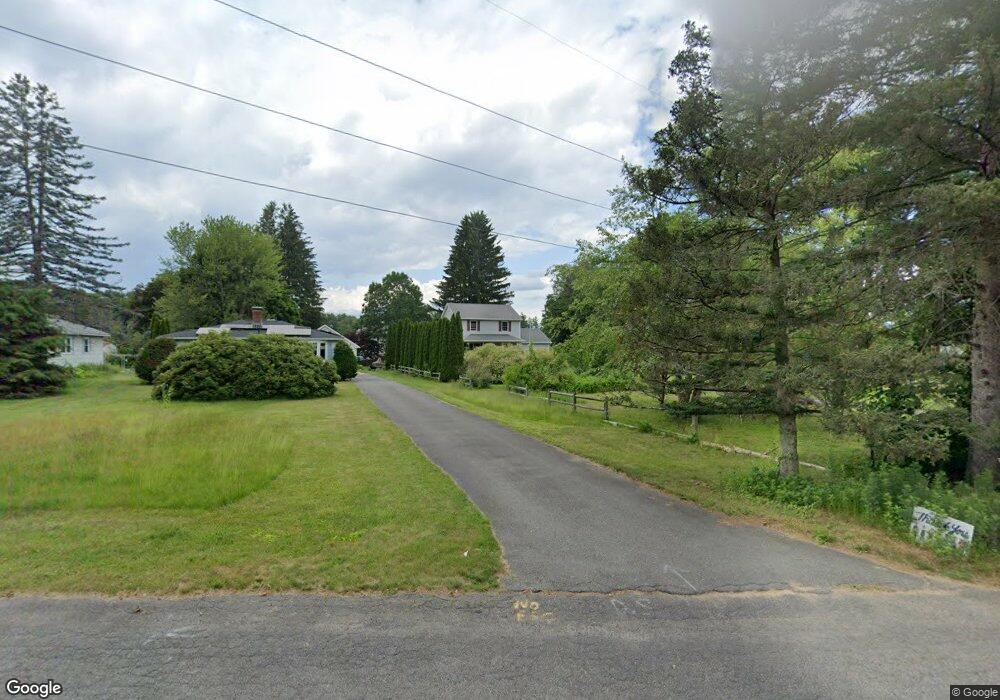
7 Richardson Cir Easthampton, MA 01027
Estimated Value: $377,000 - $407,000
3
Beds
2
Baths
1,302
Sq Ft
$299/Sq Ft
Est. Value
About This Home
This home is located at 7 Richardson Cir, Easthampton, MA 01027 and is currently estimated at $389,222, approximately $298 per square foot. 7 Richardson Cir is a home located in Hampshire County with nearby schools including Easthampton High School, Tri-County Schools, and New England Adolescent Research Institute.
Ownership History
Date
Name
Owned For
Owner Type
Purchase Details
Closed on
Sep 30, 2008
Sold by
Pierce Audrey M and Adamski Karen A
Bought by
Hulnick Donna
Current Estimated Value
Home Financials for this Owner
Home Financials are based on the most recent Mortgage that was taken out on this home.
Original Mortgage
$196,000
Interest Rate
6.57%
Mortgage Type
Purchase Money Mortgage
Purchase Details
Closed on
Apr 2, 2001
Sold by
Gosselin Roger
Bought by
Sullivan Leo C
Purchase Details
Closed on
Sep 20, 2000
Sold by
Novak Lynanne M and Novak Michael E
Bought by
Adamski Karen A and Pierce Audrey M
Purchase Details
Closed on
Jun 7, 2000
Sold by
Robert Claudia and Robert Claudia J
Bought by
Novak Lynanne M and Novak Michael E
Purchase Details
Closed on
Jun 5, 2000
Sold by
Lawrence-Treano Lisa B and Lawrence-Treano Treanor E
Bought by
Szepelak Donald J and Szepelak Shirley
Purchase Details
Closed on
Nov 20, 1992
Sold by
Lebiecki Karen M and Lebiecki Richard A
Bought by
Gosselin Darlene and Gosselin Roger
Create a Home Valuation Report for This Property
The Home Valuation Report is an in-depth analysis detailing your home's value as well as a comparison with similar homes in the area
Home Values in the Area
Average Home Value in this Area
Purchase History
| Date | Buyer | Sale Price | Title Company |
|---|---|---|---|
| Hulnick Donna | $245,000 | -- | |
| Sullivan Leo C | $129,900 | -- | |
| Adamski Karen A | $145,100 | -- | |
| Novak Lynanne M | $25,000 | -- | |
| Szepelak Donald J | $63,000 | -- | |
| Gosselin Darlene | $104,000 | -- |
Source: Public Records
Mortgage History
| Date | Status | Borrower | Loan Amount |
|---|---|---|---|
| Open | Gosselin Darlene | $194,000 | |
| Closed | Hulnick Donna | $196,000 | |
| Previous Owner | Gosselin Darlene | $88,000 |
Source: Public Records
Tax History
| Year | Tax Paid | Tax Assessment Tax Assessment Total Assessment is a certain percentage of the fair market value that is determined by local assessors to be the total taxable value of land and additions on the property. | Land | Improvement |
|---|---|---|---|---|
| 2025 | $4,555 | $333,200 | $100,800 | $232,400 |
| 2024 | $4,389 | $323,700 | $97,800 | $225,900 |
| 2023 | $3,305 | $225,600 | $77,600 | $148,000 |
| 2022 | $3,729 | $225,600 | $77,600 | $148,000 |
| 2021 | $4,099 | $233,700 | $77,600 | $156,100 |
| 2020 | $4,007 | $225,600 | $77,600 | $148,000 |
| 2019 | $3,437 | $222,300 | $77,600 | $144,700 |
| 2018 | $3,306 | $206,600 | $73,200 | $133,400 |
| 2017 | $3,223 | $198,800 | $70,300 | $128,500 |
| 2016 | $3,141 | $201,500 | $70,300 | $131,200 |
| 2015 | $3,053 | $201,500 | $70,300 | $131,200 |
Source: Public Records
Map
Nearby Homes
- 4 Gaugh St
- 40 Clark St
- 36 & 36R Holly Cir
- 2 Oak St
- 26 Winter St
- 33 Knipfer Ave
- 19 Nicols Way Unit 19
- 2 W Park Dr
- 6 S St & Abutting Lots
- 4 Laurel Dr
- 7 Union Ct
- 14 Melinda Ln
- 29 Sandra Rd
- 41 South St Unit 11
- 6 Wilton Rd
- 29 Parsons St Unit 1
- 12 Glen Cove Place Unit B
- 18-20 Oakdale Place
- 10 Glen Cove Place Unit A
- 336 Main St
- 9 Richardson Cir
- 5 Richardson Cir
- 11 Richardson Cir
- 8 David Richardson Cir
- 8 Summit Ave
- 6 Summit Ave
- 10 Richardson Cir
- 8 Richardson Cir
- 12 Summit Ave
- 12 Richardson Cir
- 13 Richardson Cir
- 126 Holyoke St
- 6 Richardson Cir
- 128 Holyoke St
- 15 Richardson Cir
- 16 Summit Ave
- 132 Holyoke St
- 7 Summit Ave
- 123 Holyoke St
- 3 Summit Ave
Your Personal Tour Guide
Ask me questions while you tour the home.