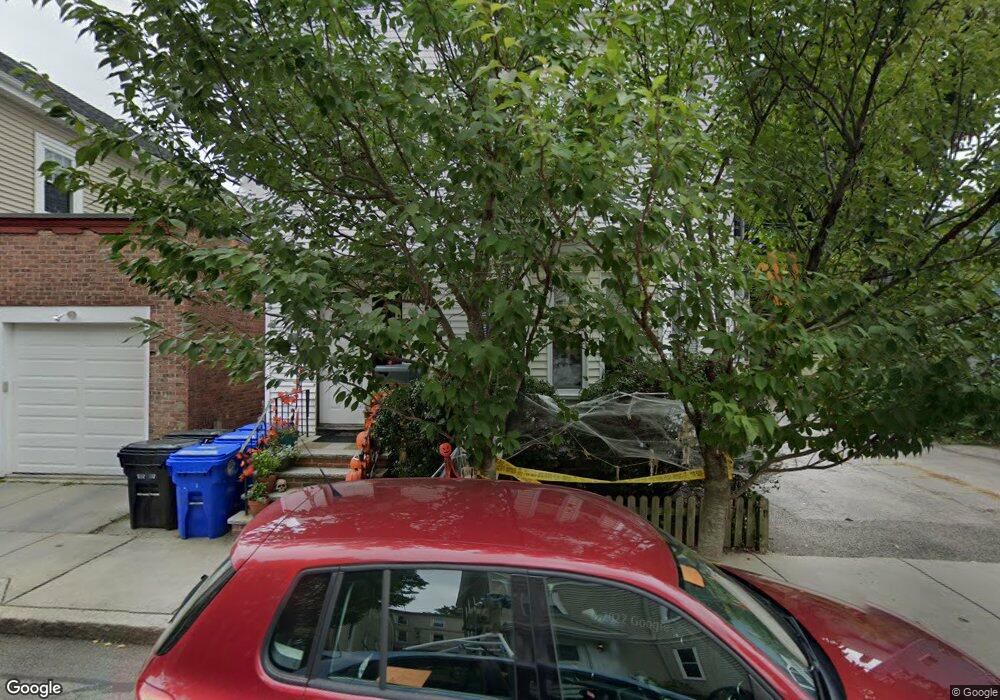
7 Roberts St Brookline, MA 02445
Brookline Village NeighborhoodEstimated Value: $1,563,000 - $1,866,000
6
Beds
3
Baths
2,979
Sq Ft
$588/Sq Ft
Est. Value
About This Home
This home is located at 7 Roberts St, Brookline, MA 02445 and is currently estimated at $1,752,333, approximately $588 per square foot. 7 Roberts St is a home located in Norfolk County with nearby schools including William H. Lincoln School, Brookline High School, and St. Mary of the Assumption Elementary School.
Ownership History
Date
Name
Owned For
Owner Type
Purchase Details
Closed on
Jan 14, 2011
Sold by
Rose Rt
Bought by
Roberts Street Realty
Current Estimated Value
Home Financials for this Owner
Home Financials are based on the most recent Mortgage that was taken out on this home.
Original Mortgage
$232,000
Outstanding Balance
$155,730
Interest Rate
4.46%
Mortgage Type
Purchase Money Mortgage
Estimated Equity
$1,596,603
Create a Home Valuation Report for This Property
The Home Valuation Report is an in-depth analysis detailing your home's value as well as a comparison with similar homes in the area
Home Values in the Area
Average Home Value in this Area
Purchase History
| Date | Buyer | Sale Price | Title Company |
|---|---|---|---|
| Roberts Street Realty | -- | -- |
Source: Public Records
Mortgage History
| Date | Status | Borrower | Loan Amount |
|---|---|---|---|
| Open | Roberts Street Realty | $232,000 |
Source: Public Records
Tax History
| Year | Tax Paid | Tax Assessment Tax Assessment Total Assessment is a certain percentage of the fair market value that is determined by local assessors to be the total taxable value of land and additions on the property. | Land | Improvement |
|---|---|---|---|---|
| 2025 | $13,300 | $1,347,500 | $649,300 | $698,200 |
| 2024 | $13,320 | $1,363,400 | $624,300 | $739,100 |
| 2023 | $12,817 | $1,285,600 | $542,900 | $742,700 |
| 2022 | $12,476 | $1,224,300 | $517,000 | $707,300 |
| 2021 | $11,537 | $1,177,200 | $497,100 | $680,100 |
| 2020 | $10,853 | $1,148,500 | $451,900 | $696,600 |
| 2019 | $10,249 | $1,093,800 | $430,400 | $663,400 |
| 2018 | $9,655 | $1,020,600 | $369,500 | $651,100 |
| 2017 | $9,337 | $945,000 | $348,600 | $596,400 |
| 2016 | $8,952 | $859,100 | $325,800 | $533,300 |
| 2015 | $8,341 | $781,000 | $304,500 | $476,500 |
| 2014 | $8,413 | $738,600 | $276,900 | $461,700 |
Source: Public Records
Map
Nearby Homes
- 209 High St
- 18 Chestnut Place
- 71 Highland Rd
- 8 Leverett St Unit 3
- 81 Glen Rd Unit S2
- 241 Perkins St Unit D405
- 241 Perkins St Unit C402
- 241 Perkins St Unit G102
- 60 Glen Rd Unit 108
- 371 Walnut St
- 21 Sargent Crossway
- 69 Walnut St Unit 2
- 69 Walnut St Unit 1
- 99 Pond Ave Unit 409
- 99 Pond Ave Unit 608
- 12 Thayer St
- 6 Juniper St Unit 16
- 77 Pond Ave Unit 1103
- 77 Pond Ave Unit 1506
- 77 Pond Ave Unit 401
- 7 Roberts St Unit 7
- 7 Roberts St Unit 3
- 7 Roberts St Unit 1
- 9 Roberts St Unit 11
- 5 Roberts St
- 5 Roberts St Unit 1 & 3
- 5 Roberts St Unit 3
- 5 Roberts St Unit 1
- One Roberts St Unit Three
- 1 Roberts St Unit 1
- 1 Roberts St
- 1 Roberts St Unit 2
- 252 Cypress St
- 252 Cypress St Unit 1
- 252 Cypress St Unit 2
- 252 Cypress St
- 252 Cypress St Unit 3
- 254 Cypress St
- 258 Cypress St Unit 260
- 258 Cypress St Unit 1
Your Personal Tour Guide
Ask me questions while you tour the home.