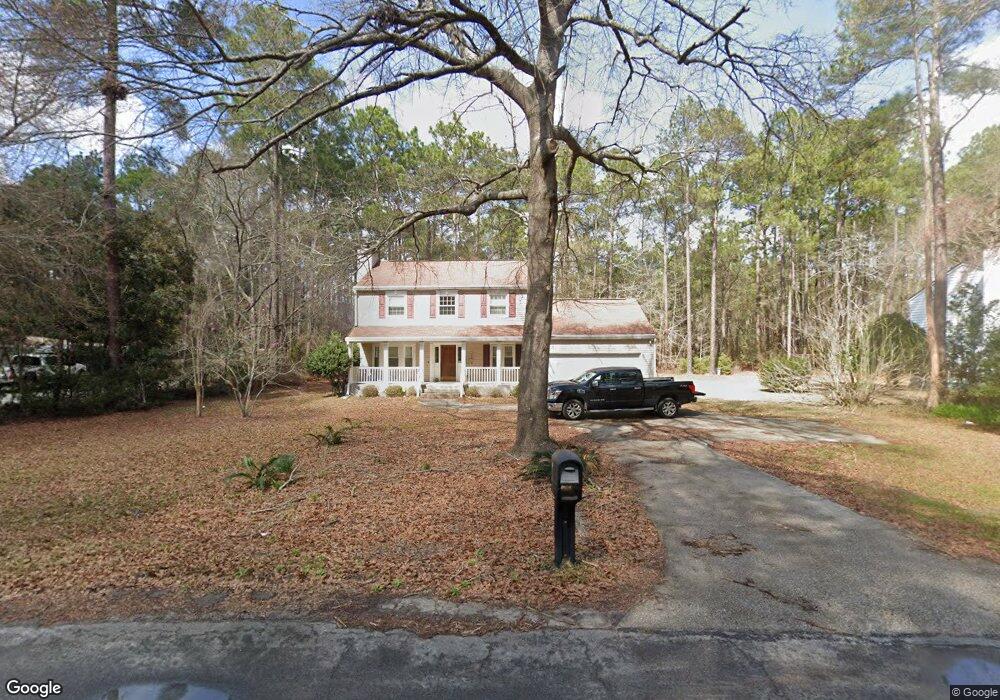
7 Robin Hood Rd Statesboro, GA 30458
Estimated Value: $319,000 - $355,000
4
Beds
3
Baths
2,314
Sq Ft
$144/Sq Ft
Est. Value
About This Home
This home is located at 7 Robin Hood Rd, Statesboro, GA 30458 and is currently estimated at $332,224, approximately $143 per square foot. 7 Robin Hood Rd is a home located in Bulloch County with nearby schools including Statesboro High School, Sallie Zetterower Elementary School, and Langston Chapel Middle School.
Ownership History
Date
Name
Owned For
Owner Type
Purchase Details
Closed on
Apr 29, 2020
Sold by
Ugorji Minette M
Bought by
Franklin Stephen
Current Estimated Value
Home Financials for this Owner
Home Financials are based on the most recent Mortgage that was taken out on this home.
Original Mortgage
$154,850
Outstanding Balance
$137,219
Interest Rate
3.3%
Mortgage Type
New Conventional
Estimated Equity
$195,005
Purchase Details
Closed on
Apr 27, 2020
Sold by
Ugorji Ebenezer Chinedum
Bought by
Ugorji Minette Sterling
Home Financials for this Owner
Home Financials are based on the most recent Mortgage that was taken out on this home.
Original Mortgage
$154,850
Outstanding Balance
$137,219
Interest Rate
3.3%
Mortgage Type
New Conventional
Estimated Equity
$195,005
Purchase Details
Closed on
Mar 1, 1988
Bought by
Ugorji Ebenezer C and Ugorji Minette
Create a Home Valuation Report for This Property
The Home Valuation Report is an in-depth analysis detailing your home's value as well as a comparison with similar homes in the area
Home Values in the Area
Average Home Value in this Area
Purchase History
| Date | Buyer | Sale Price | Title Company |
|---|---|---|---|
| Franklin Stephen | $163,000 | -- | |
| Ugorji Minette Sterling | -- | -- | |
| Ugorji Ebenezer C | -- | -- |
Source: Public Records
Mortgage History
| Date | Status | Borrower | Loan Amount |
|---|---|---|---|
| Open | Franklin Stephen | $154,850 |
Source: Public Records
Tax History Compared to Growth
Tax History
| Year | Tax Paid | Tax Assessment Tax Assessment Total Assessment is a certain percentage of the fair market value that is determined by local assessors to be the total taxable value of land and additions on the property. | Land | Improvement |
|---|---|---|---|---|
| 2024 | $3,297 | $120,280 | $18,000 | $102,280 |
| 2023 | $2,701 | $94,324 | $10,000 | $84,324 |
| 2022 | $1,597 | $81,401 | $10,000 | $71,401 |
| 2021 | $1,315 | $68,371 | $10,000 | $58,371 |
| 2020 | $1,344 | $64,781 | $8,320 | $56,461 |
| 2019 | $1,315 | $65,000 | $8,320 | $56,680 |
| 2018 | $1,286 | $61,062 | $8,320 | $52,742 |
| 2017 | $1,257 | $59,078 | $8,320 | $50,758 |
| 2016 | $1,241 | $56,891 | $8,320 | $48,571 |
| 2015 | $1,199 | $54,797 | $8,320 | $46,477 |
| 2014 | $1,101 | $54,797 | $8,320 | $46,477 |
Source: Public Records
Map
Nearby Homes
- 9 Robin Hood Rd
- 218 S Edgewood Dr
- 204 S Edgewood Dr
- 20 Greenwood Ave
- 0 Cawana Rd Unit 10619496
- 1008 Cawana Rd
- 0 Lanier Dr Unit 10329553
- 302 Parkersburg Ln
- 0 Henry Blvd Unit 10609902
- 1508 Oneal Dr
- 503 Saxon Cove
- -- Brampton Ave
- 1139 Bartlett Dr
- Cali Plan at Holly Oaks
- Kerry Plan at Holly Oaks
- Belhaven Plan at Holly Oaks
- Freeport Plan at Holly Oaks
- Manning Plan at Holly Oaks
- Robie Plan at Holly Oaks
- 321 Farmington Rd
- 5 Robin Hood Rd
- 5 Robinhood Rd
- 0 Robinhood Rd Unit 7376798
- 0 Robinhood Rd Unit 7262606
- 0 Robinhood Rd Unit 7402025
- 0 Robinhood Rd Unit 8727243
- 0 Robinhood Rd Unit 8659180
- 0 Robinhood Rd Unit 8270504
- 0 Robinhood Rd Unit 8194145
- 0 Robinhood Rd Unit 7162868
- 0 Robinhood Rd Unit 7067371
- 0 Robinhood Rd
- 11 Robin Hood Rd
- 6 Robin Hood Rd
- 3 Robin Hood Rd
- 8 Robin Hood Rd
- 109 Chelsea Cir
- 10 Robin Hood Rd
- 1 Robin Hood Rd
- 106 Chelsea Cir