
7 Sandpiper Ln East Lyme, CT 06333
4
Beds
2.5
Baths
2,212
Sq Ft
1.13
Acres
Highlights
- Medical Services
- 1.13 Acre Lot
- Colonial Architecture
- East Lyme Middle School Rated A-
- Open Floorplan
- Deck
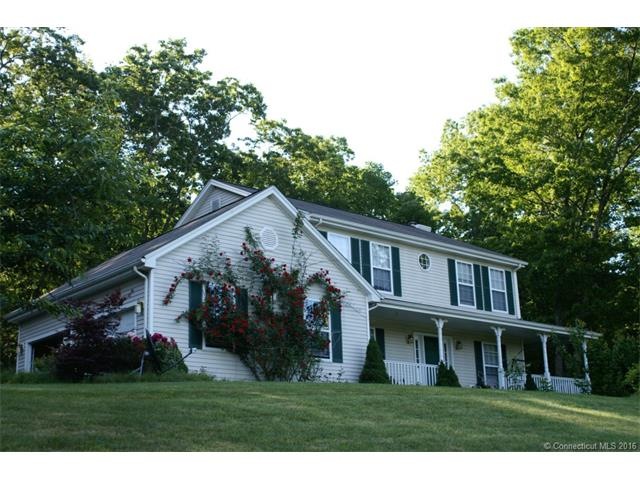
About This Home
As of June 2022LOCATION, LOCATION, LOCATION! This Inviting 4 bedroom, 2.5 bath colonial with 2 car garage sits in a quiet neighborhood. It’s easy access to everything, including walking-distance to shopping centers and high school. It has a highly desired floor plan: open kitchen with eat at counter and breakfast area with slider to deck, formal family room with fireplace and bay window, living room, dining room, and 1st floor laundry. It features with central air, master bedroom with full bath, vaulted ceiling and walk in closet. Move-in condition.
Home Details
Home Type
- Single Family
Est. Annual Taxes
- $6,089
Year Built
- Built in 1997
Lot Details
- 1.13 Acre Lot
- Sloped Lot
- Partially Wooded Lot
- Garden
Home Design
- Colonial Architecture
- Vinyl Siding
Interior Spaces
- 2,212 Sq Ft Home
- Open Floorplan
- Ceiling Fan
- 1 Fireplace
- Thermal Windows
- Attic or Crawl Hatchway Insulated
Kitchen
- Range Hood
- Dishwasher
Bedrooms and Bathrooms
- 4 Bedrooms
Laundry
- Dryer
- Washer
Unfinished Basement
- Basement Fills Entire Space Under The House
- Crawl Space
Parking
- 2 Car Attached Garage
- Parking Deck
- Private Driveway
Outdoor Features
- Wrap Around Balcony
- Deck
- Porch
Location
- Property is near shops
- Property is near a golf course
Schools
- Flanders Elementary School
- Pboe Middle School
- East Lyme Middle School
- East Lyme High School
Utilities
- Central Air
- Baseboard Heating
- Heating System Uses Oil
- Heating System Uses Oil Above Ground
- Oil Water Heater
- Cable TV Available
Community Details
Recreation
- Putting Green
Additional Features
- No Home Owners Association
- Medical Services
Ownership History
Date
Name
Owned For
Owner Type
Purchase Details
Listed on
Feb 26, 2021
Closed on
May 21, 2021
Sold by
Franzke Joseph J and Franzke Jennifer L
Bought by
Hope Natasha C and Cordes Natalie
Seller's Agent
Michelle Mayo
eXp Realty
Buyer's Agent
Valerie Stadnik
Real Broker CT, LLC
List Price
$450,000
Sold Price
$457,500
Premium/Discount to List
$7,500
1.67%
Total Days on Market
68
Current Estimated Value
Home Financials for this Owner
Home Financials are based on the most recent Mortgage that was taken out on this home.
Estimated Appreciation
$156,091
Avg. Annual Appreciation
7.65%
Original Mortgage
$468,022
Outstanding Balance
$429,513
Interest Rate
3.1%
Mortgage Type
Purchase Money Mortgage
Estimated Equity
$185,393
Purchase Details
Listed on
Dec 11, 2017
Closed on
Jul 9, 2018
Sold by
Williamson James and Williamson Melissa
Bought by
Franzke Jennifer and Franzke Joseph
Seller's Agent
Patricia Pastor
RE/MAX on the Bay
Buyer's Agent
Michelle Mayo
eXp Realty
List Price
$399,900
Sold Price
$360,000
Premium/Discount to List
-$39,900
-9.98%
Home Financials for this Owner
Home Financials are based on the most recent Mortgage that was taken out on this home.
Avg. Annual Appreciation
8.62%
Original Mortgage
$328,050
Interest Rate
4.6%
Mortgage Type
Purchase Money Mortgage
Purchase Details
Listed on
May 3, 2015
Closed on
Aug 28, 2015
Sold by
Li Gang and Xie Xuelin
Bought by
Williamson James and Williamson Melissa
Seller's Agent
Weimin Qian
Wayne Realty
Buyer's Agent
Patricia Pastor
RE/MAX on the Bay
List Price
$399,900
Sold Price
$364,000
Premium/Discount to List
-$35,900
-8.98%
Home Financials for this Owner
Home Financials are based on the most recent Mortgage that was taken out on this home.
Avg. Annual Appreciation
-0.39%
Original Mortgage
$260,000
Interest Rate
4.09%
Purchase Details
Closed on
Mar 27, 1998
Sold by
Cove Landing Assoc
Bought by
Xie Xuejin and Li Gang
Map
Create a Home Valuation Report for This Property
The Home Valuation Report is an in-depth analysis detailing your home's value as well as a comparison with similar homes in the area
Similar Homes in the area
Home Values in the Area
Average Home Value in this Area
Purchase History
| Date | Type | Sale Price | Title Company |
|---|---|---|---|
| Warranty Deed | $457,500 | None Available | |
| Warranty Deed | $360,000 | -- | |
| Warranty Deed | $364,000 | -- | |
| Warranty Deed | $243,000 | -- |
Source: Public Records
Mortgage History
| Date | Status | Loan Amount | Loan Type |
|---|---|---|---|
| Open | $468,022 | Purchase Money Mortgage | |
| Previous Owner | $328,050 | Purchase Money Mortgage | |
| Previous Owner | $260,000 | No Value Available | |
| Previous Owner | $141,800 | No Value Available | |
| Previous Owner | $150,000 | No Value Available |
Source: Public Records
Property History
| Date | Event | Price | Change | Sq Ft Price |
|---|---|---|---|---|
| 06/23/2022 06/23/22 | Sold | $526,000 | +5.4% | $238 / Sq Ft |
| 04/29/2022 04/29/22 | Pending | -- | -- | -- |
| 04/29/2022 04/29/22 | For Sale | $499,000 | 0.0% | $226 / Sq Ft |
| 04/21/2022 04/21/22 | For Sale | $499,000 | +9.1% | $226 / Sq Ft |
| 05/21/2021 05/21/21 | Sold | $457,500 | +1.7% | $207 / Sq Ft |
| 03/14/2021 03/14/21 | Pending | -- | -- | -- |
| 03/08/2021 03/08/21 | For Sale | $450,000 | +25.0% | $203 / Sq Ft |
| 06/27/2018 06/27/18 | Sold | $360,000 | -10.0% | $163 / Sq Ft |
| 05/24/2018 05/24/18 | Pending | -- | -- | -- |
| 12/11/2017 12/11/17 | For Sale | $399,900 | +9.9% | $181 / Sq Ft |
| 08/28/2015 08/28/15 | Sold | $364,000 | -9.0% | $165 / Sq Ft |
| 07/10/2015 07/10/15 | Pending | -- | -- | -- |
| 05/03/2015 05/03/15 | For Sale | $399,900 | -- | $181 / Sq Ft |
Source: SmartMLS
Tax History
| Year | Tax Paid | Tax Assessment Tax Assessment Total Assessment is a certain percentage of the fair market value that is determined by local assessors to be the total taxable value of land and additions on the property. | Land | Improvement |
|---|---|---|---|---|
| 2024 | $7,948 | $301,630 | $106,330 | $195,300 |
| 2023 | $7,505 | $301,630 | $106,330 | $195,300 |
| 2022 | $7,191 | $301,630 | $106,330 | $195,300 |
| 2021 | $6,871 | $241,010 | $96,180 | $144,830 |
| 2020 | $7,030 | $247,870 | $96,180 | $151,690 |
| 2019 | $6,987 | $247,870 | $96,180 | $151,690 |
| 2018 | $6,779 | $247,870 | $96,180 | $151,690 |
| 2017 | $6,484 | $247,870 | $96,180 | $151,690 |
| 2016 | $6,426 | $253,400 | $96,180 | $157,220 |
| 2015 | $6,262 | $253,400 | $96,180 | $157,220 |
| 2014 | $6,089 | $253,400 | $96,180 | $157,220 |
Source: Public Records
Source: SmartMLS
MLS Number: E10041973
APN: ELYM-003600-000015
Disclaimer: Certain information contained herein is derived from information provided by parties other than Homes.com. All information provided is deemed reliable, but is not guaranteed to be accurate and should be independently verified.
![]() IDX information is provided exclusively for personal, non-commercial use, and may not be used for any purpose other than to identify prospective properties consumers may be interested in purchasing. Information is deemed reliable but not guaranteed.
IDX information is provided exclusively for personal, non-commercial use, and may not be used for any purpose other than to identify prospective properties consumers may be interested in purchasing. Information is deemed reliable but not guaranteed.
Nearby Homes
- 19 Cedarbrook Ln
- 0 Cedarbrook Ln Unit 24063212
- 106 Chesterfield Rd
- 50 Gurley Rd
- 138 Boston Post Rd Unit 3
- 138 Boston Post Rd Unit 10
- 138 Boston Post Rd Unit 1
- 138 Boston Post Rd Unit 13
- 138 Boston Post Rd Unit 8
- 16 Hill Rd
- 3 Summit Ave
- 36 Upper Pattagansett Rd
- 20 Church Ln Unit 8
- 6 Oswegatchie Rd
- 57 Quailcrest Rd
- 11 King Arthur Dr Unit 6G
- 11 King Arthur Dr Unit 8K
- 6 Point Comfort
- 30 Pattagansett Dr
- 4 Amberly Ln