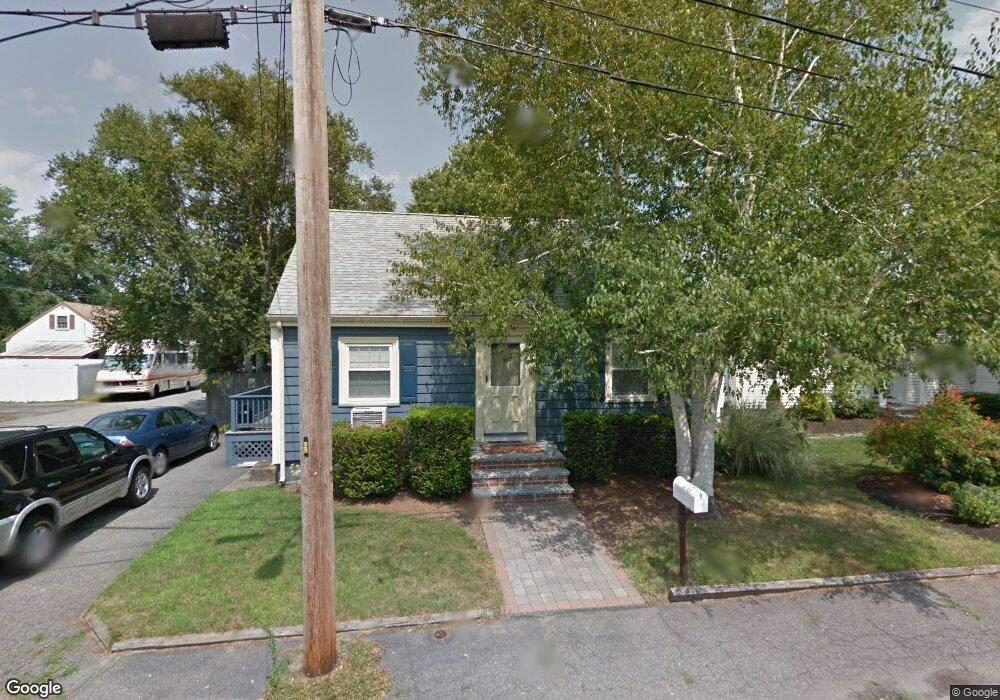
7 Sendick Rd Woburn, MA 01801
Downtown Woburn NeighborhoodEstimated Value: $650,000 - $731,000
3
Beds
2
Baths
1,229
Sq Ft
$555/Sq Ft
Est. Value
About This Home
This home is located at 7 Sendick Rd, Woburn, MA 01801 and is currently estimated at $681,882, approximately $554 per square foot. 7 Sendick Rd is a home located in Middlesex County with nearby schools including Wyman Elementary School, John F. Kennedy Middle School, and Woburn High School.
Ownership History
Date
Name
Owned For
Owner Type
Purchase Details
Closed on
Mar 22, 2017
Sold by
Callahan Francis C and Callahan Barbara J
Bought by
7 Sendick Road Irt and Callahan
Current Estimated Value
Purchase Details
Closed on
Oct 28, 1983
Bought by
Callahan Francis C
Create a Home Valuation Report for This Property
The Home Valuation Report is an in-depth analysis detailing your home's value as well as a comparison with similar homes in the area
Home Values in the Area
Average Home Value in this Area
Purchase History
| Date | Buyer | Sale Price | Title Company |
|---|---|---|---|
| 7 Sendick Road Irt | -- | -- | |
| 7 Sendick Road Irt | -- | -- | |
| Callahan Francis C | -- | -- |
Source: Public Records
Mortgage History
| Date | Status | Borrower | Loan Amount |
|---|---|---|---|
| Previous Owner | Callahan Francis C | $48,500 |
Source: Public Records
Tax History
| Year | Tax Paid | Tax Assessment Tax Assessment Total Assessment is a certain percentage of the fair market value that is determined by local assessors to be the total taxable value of land and additions on the property. | Land | Improvement |
|---|---|---|---|---|
| 2025 | $4,781 | $559,800 | $303,100 | $256,700 |
| 2024 | $4,300 | $533,500 | $288,700 | $244,800 |
| 2023 | $4,224 | $485,500 | $262,400 | $223,100 |
| 2022 | $4,094 | $438,300 | $228,200 | $210,100 |
| 2021 | $3,944 | $422,700 | $217,300 | $205,400 |
| 2020 | $3,771 | $404,600 | $217,300 | $187,300 |
| 2019 | $3,677 | $387,000 | $207,000 | $180,000 |
| 2018 | $3,490 | $352,900 | $189,900 | $163,000 |
| 2017 | $3,273 | $329,300 | $180,900 | $148,400 |
| 2016 | $3,123 | $310,700 | $169,000 | $141,700 |
| 2015 | $3,003 | $295,300 | $158,000 | $137,300 |
| 2014 | $2,765 | $264,800 | $158,000 | $106,800 |
Source: Public Records
Map
Nearby Homes
Your Personal Tour Guide
Ask me questions while you tour the home.