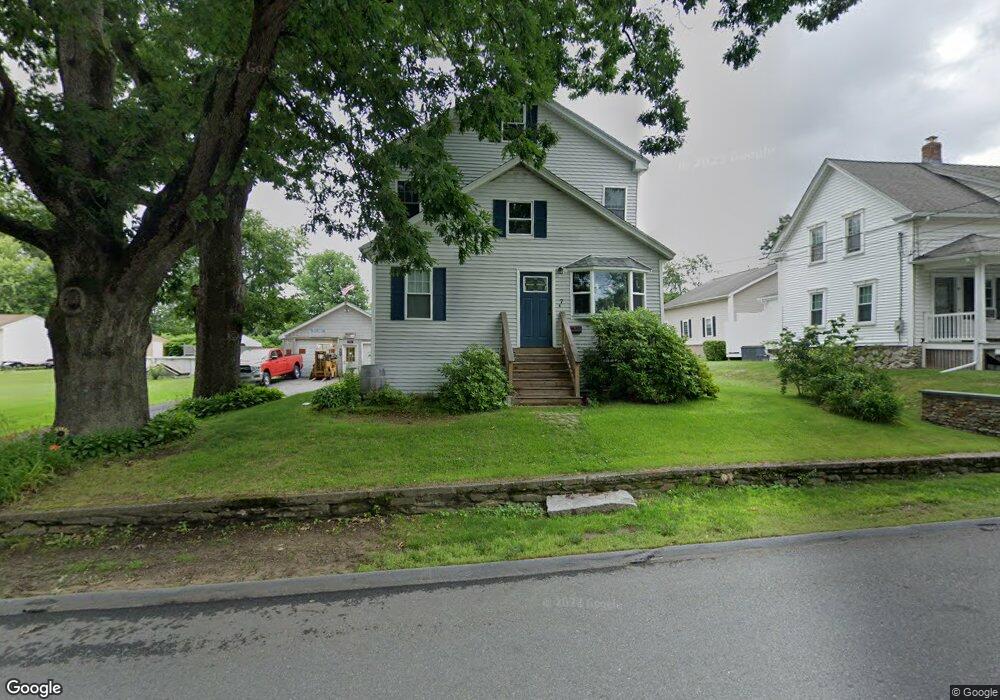
7 Sibley St Auburn, MA 01501
West Auburn NeighborhoodEstimated Value: $335,000 - $586,000
4
Beds
2
Baths
2,027
Sq Ft
$222/Sq Ft
Est. Value
About This Home
This home is located at 7 Sibley St, Auburn, MA 01501 and is currently estimated at $449,989, approximately $221 per square foot. 7 Sibley St is a home located in Worcester County with nearby schools including Auburn Senior High School and Shrewsbury Montessori School - Auburn Campus.
Ownership History
Date
Name
Owned For
Owner Type
Purchase Details
Closed on
Jul 10, 2001
Sold by
Warner John R
Bought by
Hamilton Timothy D
Current Estimated Value
Home Financials for this Owner
Home Financials are based on the most recent Mortgage that was taken out on this home.
Original Mortgage
$122,800
Interest Rate
7.21%
Mortgage Type
Purchase Money Mortgage
Create a Home Valuation Report for This Property
The Home Valuation Report is an in-depth analysis detailing your home's value as well as a comparison with similar homes in the area
Home Values in the Area
Average Home Value in this Area
Purchase History
| Date | Buyer | Sale Price | Title Company |
|---|---|---|---|
| Hamilton Timothy D | $123,800 | -- |
Source: Public Records
Mortgage History
| Date | Status | Borrower | Loan Amount |
|---|---|---|---|
| Open | Hamilton Timothy D | $147,028 | |
| Closed | Hamilton Timothy D | $121,034 | |
| Closed | Hamilton Timothy D | $122,800 |
Source: Public Records
Tax History Compared to Growth
Tax History
| Year | Tax Paid | Tax Assessment Tax Assessment Total Assessment is a certain percentage of the fair market value that is determined by local assessors to be the total taxable value of land and additions on the property. | Land | Improvement |
|---|---|---|---|---|
| 2025 | $58 | $407,600 | $109,200 | $298,400 |
| 2024 | $5,721 | $383,200 | $104,000 | $279,200 |
| 2023 | $5,248 | $330,500 | $94,600 | $235,900 |
| 2022 | $4,932 | $293,200 | $94,600 | $198,600 |
| 2021 | $4,445 | $255,100 | $83,500 | $171,600 |
| 2020 | $4,020 | $223,600 | $83,500 | $140,100 |
| 2019 | $3,957 | $214,800 | $78,300 | $136,500 |
| 2018 | $3,781 | $206,900 | $73,200 | $133,700 |
| 2017 | $3,670 | $200,100 | $66,400 | $133,700 |
| 2016 | $3,571 | $197,400 | $69,500 | $127,900 |
| 2015 | $3,364 | $194,900 | $69,500 | $125,400 |
| 2014 | $3,045 | $176,100 | $66,200 | $109,900 |
Source: Public Records
Map
Nearby Homes