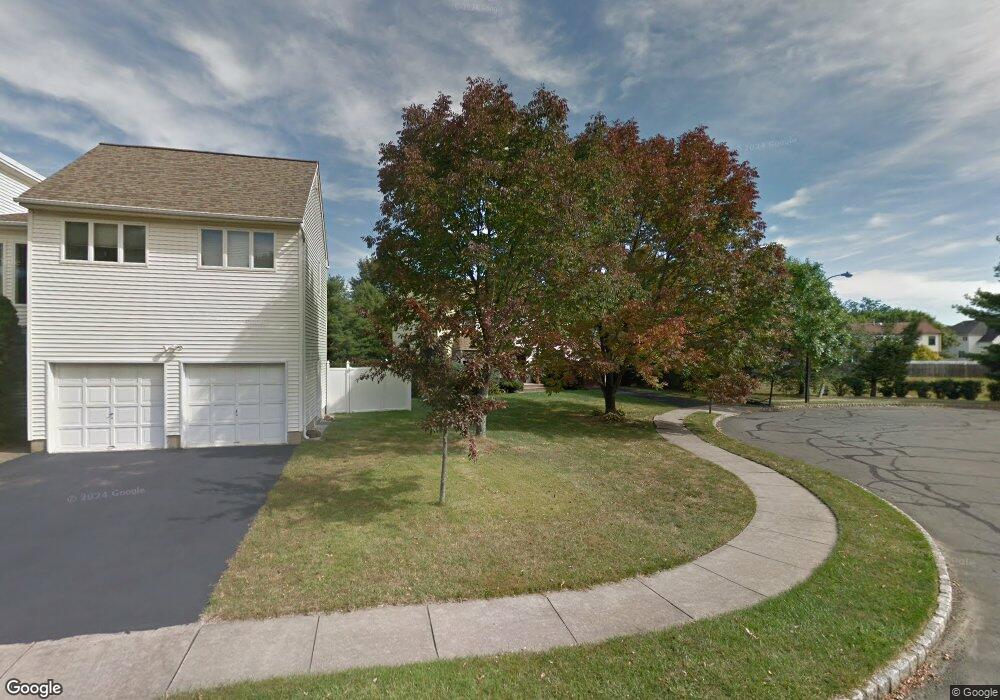
7 Signal Ct Dayton, NJ 08810
Estimated Value: $789,828 - $864,000
3
Beds
3
Baths
2,258
Sq Ft
$363/Sq Ft
Est. Value
About This Home
This home is located at 7 Signal Ct, Dayton, NJ 08810 and is currently estimated at $820,707, approximately $363 per square foot. 7 Signal Ct is a home located in Middlesex County with nearby schools including Indian Fields Elementary School, Crossroads South Middle School, and South Brunswick High School.
Ownership History
Date
Name
Owned For
Owner Type
Purchase Details
Closed on
Jan 14, 2019
Sold by
Hirsch Edward and Hirsch Linda
Bought by
Singh Satvinder and Kaur Bhavpreet
Current Estimated Value
Home Financials for this Owner
Home Financials are based on the most recent Mortgage that was taken out on this home.
Original Mortgage
$380,000
Outstanding Balance
$334,097
Interest Rate
4.6%
Mortgage Type
New Conventional
Estimated Equity
$486,610
Purchase Details
Closed on
Apr 18, 1988
Bought by
Hirsch Edward and Hirsch Linda
Create a Home Valuation Report for This Property
The Home Valuation Report is an in-depth analysis detailing your home's value as well as a comparison with similar homes in the area
Home Values in the Area
Average Home Value in this Area
Purchase History
| Date | Buyer | Sale Price | Title Company |
|---|---|---|---|
| Singh Satvinder | $425,000 | Golden Title Agency Llc | |
| Hirsch Edward | $218,900 | -- |
Source: Public Records
Mortgage History
| Date | Status | Borrower | Loan Amount |
|---|---|---|---|
| Open | Singh Satvinder | $380,000 |
Source: Public Records
Tax History Compared to Growth
Tax History
| Year | Tax Paid | Tax Assessment Tax Assessment Total Assessment is a certain percentage of the fair market value that is determined by local assessors to be the total taxable value of land and additions on the property. | Land | Improvement |
|---|---|---|---|---|
| 2025 | $10,772 | $199,400 | $69,000 | $130,400 |
| 2024 | $10,385 | $199,400 | $69,000 | $130,400 |
| 2023 | $10,385 | $199,400 | $69,000 | $130,400 |
| 2022 | $10,076 | $199,400 | $69,000 | $130,400 |
| 2021 | $7,755 | $199,400 | $69,000 | $130,400 |
| 2020 | $10,138 | $199,400 | $69,000 | $130,400 |
| 2019 | $10,229 | $199,400 | $69,000 | $130,400 |
| 2018 | $9,894 | $199,400 | $69,000 | $130,400 |
| 2017 | $9,880 | $199,400 | $69,000 | $130,400 |
| 2016 | $9,777 | $199,400 | $69,000 | $130,400 |
| 2015 | $9,477 | $199,400 | $69,000 | $130,400 |
| 2014 | $9,324 | $199,400 | $69,000 | $130,400 |
Source: Public Records
Map
Nearby Homes
- 24 Pullman Loop
- 9 Haypress Rd
- 385 Ridge Rd
- 36 Haypress Rd
- 29 Liberty Dr
- 19 Wetherhill Way
- 4 Lincoln Ln Unit F4
- 408 Blossom Cir
- 8 Quincy Cir Unit G
- 342 Ridge Rd
- Q10 Quincy Cir Unit Q-10
- G8 Quincy Cir Unit G
- 10-Q Dayton Cir
- 1106 Dahlia Cir
- 605 Dahlia Cir
- 10 Quincy Cir
- 1401 Yarrow Cir
- 45 Hannah Dr
- 3 Hannah Dr
- 29 Jeffrey Cir