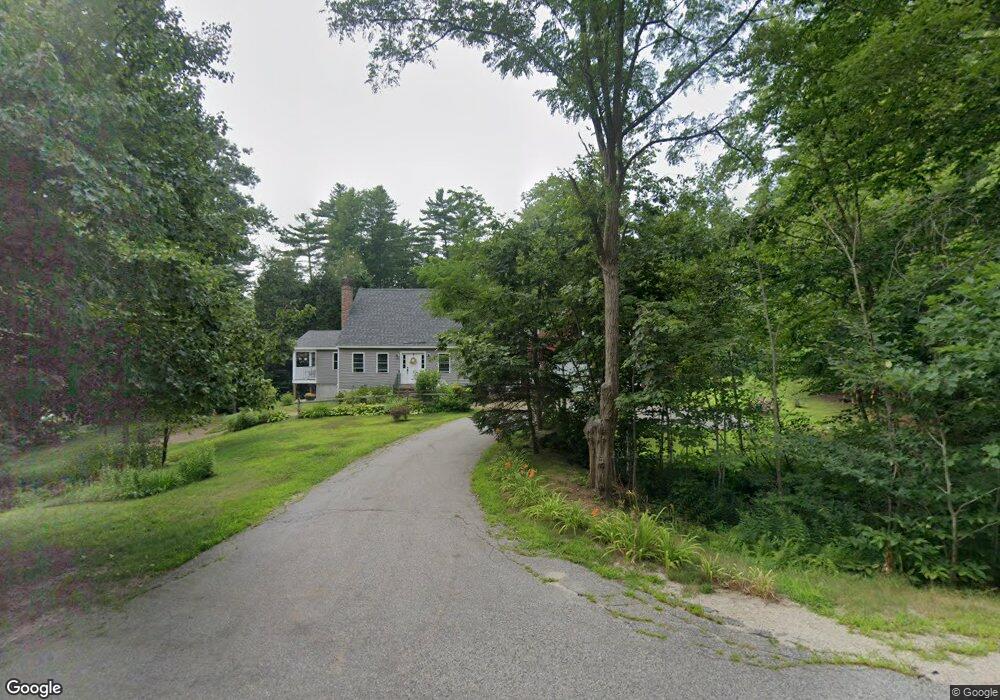
7 Sleepy Hollow Wolfeboro, NH 03894
Estimated Value: $540,000 - $631,000
4
Beds
3
Baths
2,552
Sq Ft
$230/Sq Ft
Est. Value
About This Home
This home is located at 7 Sleepy Hollow, Wolfeboro, NH 03894 and is currently estimated at $586,861, approximately $229 per square foot. 7 Sleepy Hollow is a home located in Carroll County with nearby schools including Crescent Lake School, Carpenter Elementary School, and Kingswood Regional Middle School.
Ownership History
Date
Name
Owned For
Owner Type
Purchase Details
Closed on
Mar 8, 2017
Sold by
Marshall Steven and Marshall Lisa
Bought by
Godwin Timothy J and Goodwin Lisa A
Current Estimated Value
Home Financials for this Owner
Home Financials are based on the most recent Mortgage that was taken out on this home.
Original Mortgage
$188,000
Outstanding Balance
$152,716
Interest Rate
3.63%
Mortgage Type
Adjustable Rate Mortgage/ARM
Estimated Equity
$434,145
Purchase Details
Closed on
Dec 7, 2016
Sold by
Renaissance Home Equit
Bought by
Marshall Steven and Marshall Lisa
Purchase Details
Closed on
Jul 12, 2016
Sold by
Wright Carolyn J
Bought by
Hsbc Bank Usa Na Tr
Purchase Details
Closed on
Apr 20, 1999
Sold by
Snyder Warren P and Snyder Phyllis
Bought by
Wright Carolyn Jean
Home Financials for this Owner
Home Financials are based on the most recent Mortgage that was taken out on this home.
Original Mortgage
$107,000
Interest Rate
7.04%
Create a Home Valuation Report for This Property
The Home Valuation Report is an in-depth analysis detailing your home's value as well as a comparison with similar homes in the area
Home Values in the Area
Average Home Value in this Area
Purchase History
| Date | Buyer | Sale Price | Title Company |
|---|---|---|---|
| Godwin Timothy J | $235,000 | -- | |
| Marshall Steven | $152,866 | -- | |
| Hsbc Bank Usa Na Tr | $174,000 | -- | |
| Wright Carolyn Jean | $127,000 | -- |
Source: Public Records
Mortgage History
| Date | Status | Borrower | Loan Amount |
|---|---|---|---|
| Open | Godwin Timothy J | $188,000 | |
| Previous Owner | Wright Carolyn Jean | $107,000 |
Source: Public Records
Tax History Compared to Growth
Tax History
| Year | Tax Paid | Tax Assessment Tax Assessment Total Assessment is a certain percentage of the fair market value that is determined by local assessors to be the total taxable value of land and additions on the property. | Land | Improvement |
|---|---|---|---|---|
| 2024 | $5,142 | $323,400 | $88,200 | $235,200 |
| 2023 | $4,757 | $323,800 | $88,200 | $235,600 |
| 2022 | $3,954 | $299,100 | $88,200 | $210,900 |
| 2021 | $4,087 | $299,000 | $88,200 | $210,800 |
| 2020 | $3,256 | $250,300 | $88,200 | $162,100 |
| 2019 | $3,263 | $206,000 | $77,400 | $128,600 |
| 2018 | $3,128 | $198,000 | $77,400 | $120,600 |
| 2017 | $2,966 | $198,000 | $77,400 | $120,600 |
| 2016 | $2,897 | $198,000 | $77,400 | $120,600 |
| 2015 | $2,762 | $198,000 | $77,400 | $120,600 |
| 2014 | $2,448 | $188,200 | $55,700 | $132,500 |
| 2013 | $2,415 | $188,200 | $55,700 | $132,500 |
Source: Public Records
Map
Nearby Homes
- 45 Winnipesaukee Dr
- 87 Middleton Rd
- 106 Middleton Rd
- 116 Middleton Rd
- 18-8 Winnipesaukee Dr
- 267-23 Winnipesaukee Dr
- 00 Winnipesaukee Dr Unit 10
- 39 Winnipesaukee Dr
- 87 Timberlane P
- 0 Long Stack Ln
- 5 Delings Cove Rd
- 337 S Main St Unit Interval week 4 Janu
- 117 Hayes Rd
- 21 Goodrich Rd
- 163 Clark Rd
- 79 S Main St
- 25 Clay Point Rd
- 120 Big Barndoor Island
- 7 Sleepy Hollow Rd
- 5 Sleepy Hollow Rd
- 9 Sleepy Hollow Rd
- 37 Sleepy Hollow
- 24 Sleepy Hollow Rd
- 0 Sleepy Hollow
- 11 Sleepy Hollow Rd
- 22 Sleepy Hollow Rd
- 3 Sleepy Hollow Rd
- 23 Sleepy Hollow Rd
- 2 Sleepy Hollow
- 2 Sleepy Hollow Rd
- 20 Sleepy Hollow Rd
- 23 Middleton Rd
- 21 Sleepy Hollow Rd
- 29 Middleton Rd
- 55 Middleton Rd
- 19 Sleepy Hollow Rd
- 61 Middleton Rd
- 30 Middleton Rd