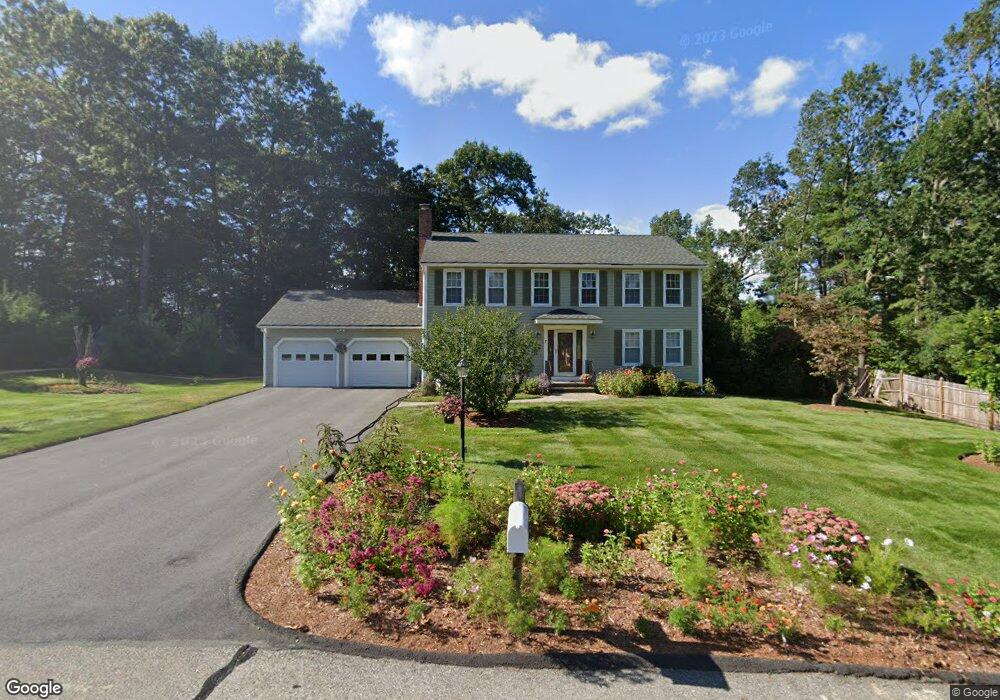
7 Sparta Way Andover, MA 01810
Estimated Value: $1,168,340 - $1,389,000
4
Beds
3
Baths
3,335
Sq Ft
$383/Sq Ft
Est. Value
About This Home
This home is located at 7 Sparta Way, Andover, MA 01810 and is currently estimated at $1,278,835, approximately $383 per square foot. 7 Sparta Way is a home located in Essex County with nearby schools including South Elementary School, Andover West Middle School, and Andover High School.
Ownership History
Date
Name
Owned For
Owner Type
Purchase Details
Closed on
Dec 12, 2019
Sold by
Gentile Anthony F
Bought by
Anthony F Gentile Jr Irt and Gentile
Current Estimated Value
Purchase Details
Closed on
Jan 17, 2018
Sold by
Gentile Anthony F and Gentile Denise M
Bought by
Gentile Denise M and Gentile Anthony F
Purchase Details
Closed on
Jul 10, 1987
Sold by
Spring Valley Devop
Bought by
Gentile Anthony F
Create a Home Valuation Report for This Property
The Home Valuation Report is an in-depth analysis detailing your home's value as well as a comparison with similar homes in the area
Home Values in the Area
Average Home Value in this Area
Purchase History
| Date | Buyer | Sale Price | Title Company |
|---|---|---|---|
| Anthony F Gentile Jr Irt | -- | None Available | |
| Denise M Gentile Irt | -- | None Available | |
| Anthony F Gentile Jr Irt | -- | None Available | |
| Gentile Denise M | -- | -- | |
| Denise M Gentile Irt | -- | -- | |
| Anthony F Gentile Jr I F | -- | -- | |
| Gentile Denise M | -- | -- | |
| Gentile Anthony F | $299,990 | -- |
Source: Public Records
Mortgage History
| Date | Status | Borrower | Loan Amount |
|---|---|---|---|
| Previous Owner | Gentile Anthony F | $50,000 | |
| Previous Owner | Gentile Anthony F | $50,000 |
Source: Public Records
Tax History Compared to Growth
Tax History
| Year | Tax Paid | Tax Assessment Tax Assessment Total Assessment is a certain percentage of the fair market value that is determined by local assessors to be the total taxable value of land and additions on the property. | Land | Improvement |
|---|---|---|---|---|
| 2024 | $11,817 | $917,500 | $439,100 | $478,400 |
| 2023 | $11,047 | $808,700 | $375,500 | $433,200 |
| 2022 | $10,604 | $726,300 | $338,400 | $387,900 |
| 2021 | $10,179 | $665,700 | $307,800 | $357,900 |
| 2020 | $9,913 | $660,400 | $307,800 | $352,600 |
| 2019 | $10,003 | $655,100 | $307,800 | $347,300 |
| 2018 | $9,692 | $619,700 | $298,900 | $320,800 |
| 2017 | $9,308 | $613,200 | $292,900 | $320,300 |
| 2016 | $9,116 | $615,100 | $292,900 | $322,200 |
| 2015 | $8,954 | $598,100 | $292,900 | $305,200 |
Source: Public Records
Map
Nearby Homes