Estimated Value: $763,000 - $874,714
4
Beds
3
Baths
2,365
Sq Ft
$343/Sq Ft
Est. Value
About This Home
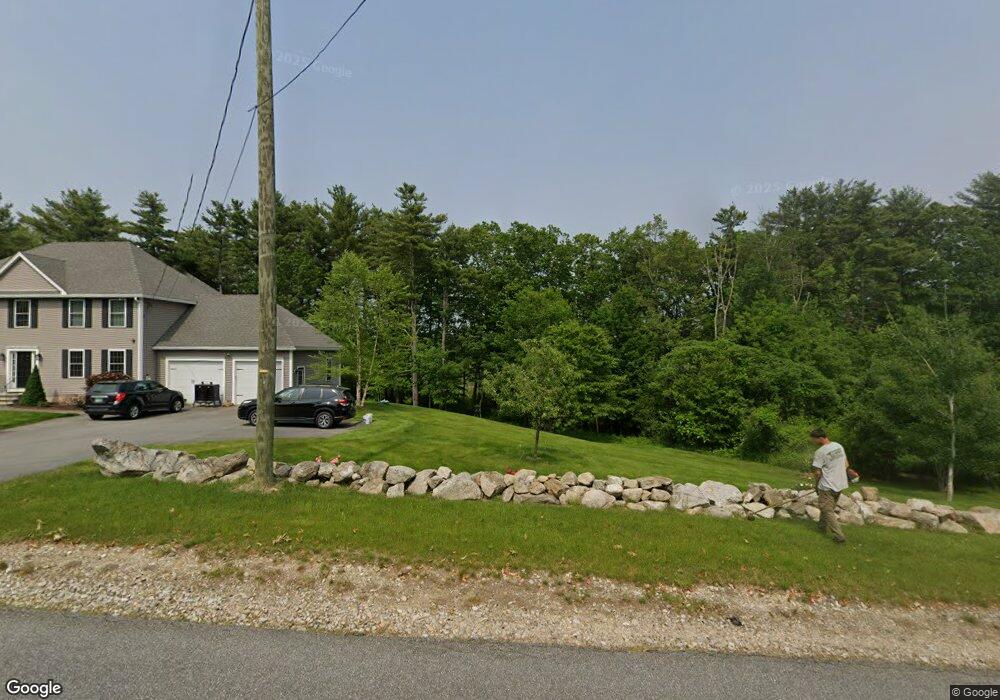
This home is located at 7 Stark Rd Unit 3/130/002, Derry, NH 03038 and is currently estimated at $812,179, approximately $343 per square foot. 7 Stark Rd Unit 3/130/002 is a home located in Rockingham County with nearby schools including Derry Village School, West Running Brook Middle School, and Pinkerton Academy.
Ownership History
Date
Name
Owned For
Owner Type
Purchase Details
Closed on
Jul 25, 2018
Sold by
Liskowsky Joseph P and Stout Jaime
Bought by
Mason Ann Marie M and Mason William C
Current Estimated Value
Home Financials for this Owner
Home Financials are based on the most recent Mortgage that was taken out on this home.
Original Mortgage
$373,600
Outstanding Balance
$324,496
Interest Rate
4.6%
Mortgage Type
Purchase Money Mortgage
Estimated Equity
$487,683
Purchase Details
Closed on
Feb 6, 2018
Sold by
Mhb Development Corp
Bought by
Liskowsky Joseph P and Stout Jaime
Home Financials for this Owner
Home Financials are based on the most recent Mortgage that was taken out on this home.
Original Mortgage
$412,205
Interest Rate
3.94%
Mortgage Type
New Conventional
Create a Home Valuation Report for This Property
The Home Valuation Report is an in-depth analysis detailing your home's value as well as a comparison with similar homes in the area
Home Values in the Area
Average Home Value in this Area
Purchase History
| Date | Buyer | Sale Price | Title Company |
|---|---|---|---|
| Mason Ann Marie M | $467,000 | -- | |
| Liskowsky Joseph P | $434,400 | -- |
Source: Public Records
Mortgage History
| Date | Status | Borrower | Loan Amount |
|---|---|---|---|
| Open | Mason Ann Marie M | $373,600 | |
| Previous Owner | Liskowsky Joseph P | $412,205 |
Source: Public Records
Tax History Compared to Growth
Tax History
| Year | Tax Paid | Tax Assessment Tax Assessment Total Assessment is a certain percentage of the fair market value that is determined by local assessors to be the total taxable value of land and additions on the property. | Land | Improvement |
|---|---|---|---|---|
| 2024 | $14,849 | $794,500 | $209,900 | $584,600 |
| 2023 | $14,462 | $699,300 | $178,400 | $520,900 |
| 2022 | $13,315 | $699,300 | $178,400 | $520,900 |
| 2021 | $12,363 | $499,300 | $138,300 | $361,000 |
| 2020 | $12,153 | $499,300 | $138,300 | $361,000 |
| 2019 | $12,248 | $468,900 | $108,700 | $360,200 |
| 2018 | $12,205 | $468,900 | $108,700 | $360,200 |
| 2017 | $7,056 | $244,500 | $103,700 | $140,800 |
| 2016 | $21 | $775 | $775 | $0 |
| 2015 | $23 | $775 | $775 | $0 |
| 2014 | $23 | $775 | $775 | $0 |
| 2013 | $28 | $885 | $885 | $0 |
Source: Public Records
Map
Nearby Homes
- 5A Homestead Dr Unit A
- 5A Homestead Dr
- 242 Rockingham Rd
- 22 Jacob Rd
- 13 Craven Terrace
- 26 Partridge Rd
- 139 Rockingham Rd Unit 21
- 139 Rockingham Rd Unit 30
- 2 Kinsman Ln
- 2 Brown Rd
- 7 Evergreen Way
- 144 Rockingham Rd
- 100 Rockingham Rd Unit 9
- 3 Evergreen Way
- 24 Rockingham Rd
- 39 Overton Rd
- 5 Sunnyside Ln Unit R
- 29 Hawk Dr
- 41 Trails Edge Rd
- 90L Derryfield Rd