7 Station St Pembroke, MA 02359
Estimated Value: $730,000 - $828,000
4
Beds
2
Baths
2,626
Sq Ft
$295/Sq Ft
Est. Value
About This Home
This home is located at 7 Station St, Pembroke, MA 02359 and is currently estimated at $774,396, approximately $294 per square foot. 7 Station St is a home located in Plymouth County with nearby schools including Pembroke High School.
Ownership History
Date
Name
Owned For
Owner Type
Purchase Details
Closed on
Apr 12, 2019
Sold by
Priolo Rt Llc
Bought by
Saeed Sumeer and Asif Manal
Current Estimated Value
Home Financials for this Owner
Home Financials are based on the most recent Mortgage that was taken out on this home.
Original Mortgage
$531,715
Outstanding Balance
$467,472
Interest Rate
4.3%
Mortgage Type
New Conventional
Estimated Equity
$306,924
Purchase Details
Closed on
May 21, 2013
Sold by
Hanrahan Steven
Bought by
Hanrahan Catherine D
Home Financials for this Owner
Home Financials are based on the most recent Mortgage that was taken out on this home.
Original Mortgage
$295,000
Interest Rate
3.57%
Mortgage Type
New Conventional
Purchase Details
Closed on
Oct 1, 2001
Sold by
Sanchez Israel M and Sanchez Roxanne
Bought by
Hanrahan Steven J
Purchase Details
Closed on
Aug 4, 1997
Sold by
Sukla Rt and Dunning Elaine M
Bought by
Sanchez Israel M and Gordon Roxanne E
Create a Home Valuation Report for This Property
The Home Valuation Report is an in-depth analysis detailing your home's value as well as a comparison with similar homes in the area
Home Values in the Area
Average Home Value in this Area
Purchase History
| Date | Buyer | Sale Price | Title Company |
|---|---|---|---|
| Saeed Sumeer | $559,700 | -- | |
| Hanrahan Catherine D | -- | -- | |
| Hanrahan Steven J | $272,500 | -- | |
| Sanchez Israel M | $173,000 | -- |
Source: Public Records
Mortgage History
| Date | Status | Borrower | Loan Amount |
|---|---|---|---|
| Open | Saeed Sumeer | $531,715 | |
| Previous Owner | Hanrahan Catherine D | $295,000 | |
| Previous Owner | Sanchez Israel M | $127,000 | |
| Previous Owner | Sanchez Israel M | $92,000 |
Source: Public Records
Tax History Compared to Growth
Tax History
| Year | Tax Paid | Tax Assessment Tax Assessment Total Assessment is a certain percentage of the fair market value that is determined by local assessors to be the total taxable value of land and additions on the property. | Land | Improvement |
|---|---|---|---|---|
| 2025 | $6,993 | $581,800 | $280,700 | $301,100 |
| 2024 | $6,610 | $549,500 | $275,900 | $273,600 |
| 2023 | $6,785 | $533,400 | $275,900 | $257,500 |
| 2022 | $6,144 | $434,200 | $225,700 | $208,500 |
| 2021 | $5,968 | $409,300 | $215,300 | $194,000 |
| 2020 | $5,668 | $391,200 | $205,700 | $185,500 |
| 2019 | $5,590 | $382,900 | $200,500 | $182,400 |
| 2018 | $5,277 | $354,400 | $185,700 | $168,700 |
| 2017 | $5,225 | $346,000 | $175,700 | $170,300 |
| 2016 | $5,149 | $337,400 | $165,700 | $171,700 |
| 2015 | $4,770 | $323,600 | $150,500 | $173,100 |
Source: Public Records
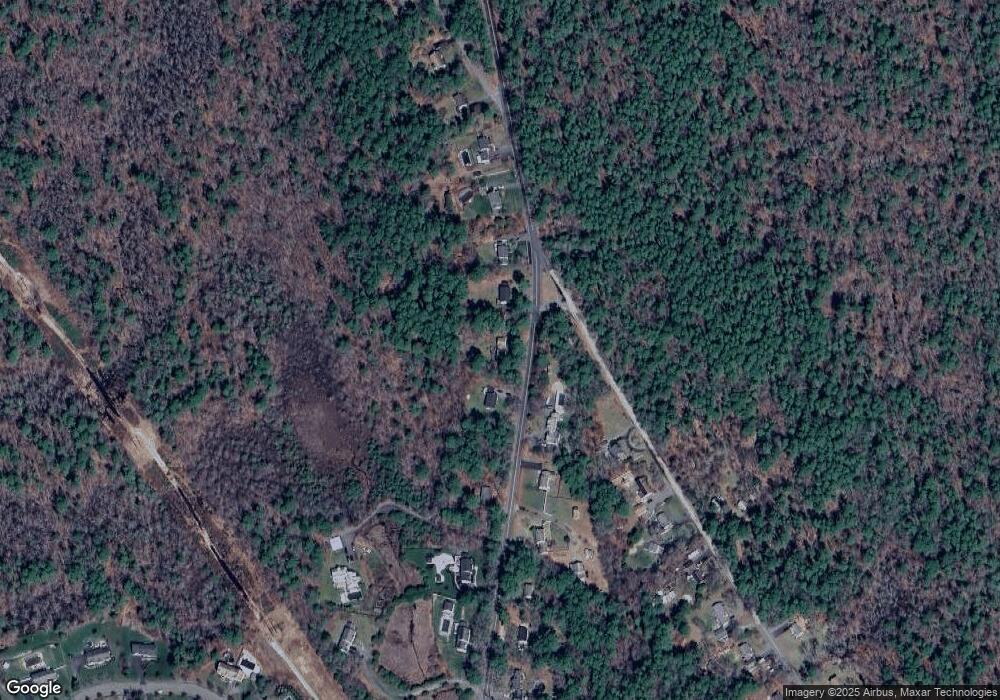
Map
Nearby Homes
- 9 Montclair Ave
- 345 Forest St
- 61 Chapel St
- 16 Chapel St
- 21 Prince Way
- 202 Birch St
- 25 Little Brook Rd
- 32 Little Brook Rd
- 56 & 60 Prince Way
- 234 Forest St
- 27 Chestnut Rd
- 20 Edward Dr
- 0 Wildwood Cir
- 48 Grove St
- 57 Brandeis Cir
- 298 Autumn Ave
- 600 Summer St Unit 6
- 346 Summer St
- 820 Center St
- 6 Carriage Ln Unit 6