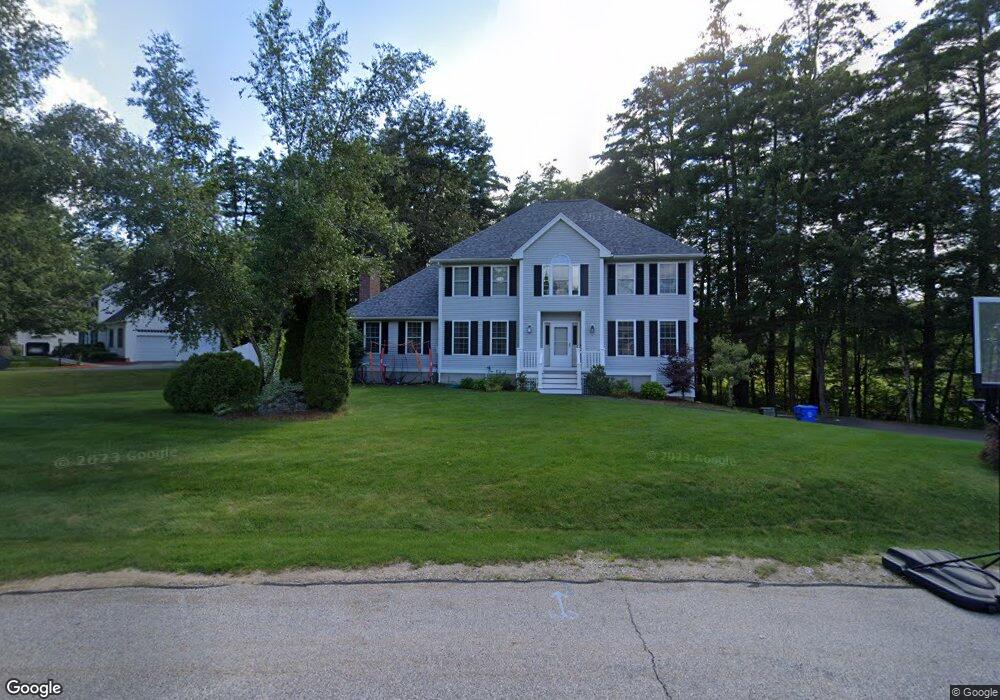
7 Sterling Dr Londonderry, NH 03053
Estimated Value: $788,857 - $960,000
4
Beds
3
Baths
3,447
Sq Ft
$254/Sq Ft
Est. Value
About This Home
This home is located at 7 Sterling Dr, Londonderry, NH 03053 and is currently estimated at $876,964, approximately $254 per square foot. 7 Sterling Dr is a home located in Rockingham County with nearby schools including North Londonderry Elementary School, Londonderry Middle School, and Londonderry Senior High School.
Ownership History
Date
Name
Owned For
Owner Type
Purchase Details
Closed on
Jul 22, 2010
Sold by
Pearce Timothy J and Pearce Amy W
Bought by
Testa Ryan and Testa Amanda
Current Estimated Value
Home Financials for this Owner
Home Financials are based on the most recent Mortgage that was taken out on this home.
Original Mortgage
$424,286
Interest Rate
4.75%
Mortgage Type
FHA
Purchase Details
Closed on
Oct 21, 2002
Sold by
Barrett Jeffrey S and Barrett Shelly B
Bought by
Pearce Timothy J and Pearce Amy W
Home Financials for this Owner
Home Financials are based on the most recent Mortgage that was taken out on this home.
Original Mortgage
$330,000
Interest Rate
6.18%
Purchase Details
Closed on
Jul 3, 2000
Sold by
Lucarelli David M and Lucarelli Jennifer A
Bought by
Barrett Jeffrey S and Barrett Shelly B
Purchase Details
Closed on
Apr 30, 1999
Sold by
Gagnon Jean M
Bought by
Lucarelli David M and Lucarelli Jennifer A
Create a Home Valuation Report for This Property
The Home Valuation Report is an in-depth analysis detailing your home's value as well as a comparison with similar homes in the area
Home Values in the Area
Average Home Value in this Area
Purchase History
| Date | Buyer | Sale Price | Title Company |
|---|---|---|---|
| Testa Ryan | $430,000 | -- | |
| Pearce Timothy J | $382,000 | -- | |
| Barrett Jeffrey S | $289,900 | -- | |
| Lucarelli David M | $234,600 | -- |
Source: Public Records
Mortgage History
| Date | Status | Borrower | Loan Amount |
|---|---|---|---|
| Open | Lucarelli David M | $409,110 | |
| Closed | Lucarelli David M | $424,286 | |
| Previous Owner | Lucarelli David M | $66,100 | |
| Previous Owner | Lucarelli David M | $330,000 |
Source: Public Records
Tax History Compared to Growth
Tax History
| Year | Tax Paid | Tax Assessment Tax Assessment Total Assessment is a certain percentage of the fair market value that is determined by local assessors to be the total taxable value of land and additions on the property. | Land | Improvement |
|---|---|---|---|---|
| 2024 | $10,822 | $670,500 | $220,800 | $449,700 |
| 2023 | $10,493 | $670,500 | $220,800 | $449,700 |
| 2022 | $9,968 | $539,400 | $165,500 | $373,900 |
| 2021 | $9,914 | $539,400 | $165,500 | $373,900 |
| 2020 | $10,162 | $505,300 | $134,800 | $370,500 |
| 2019 | $9,798 | $505,300 | $134,800 | $370,500 |
| 2018 | $9,184 | $421,300 | $111,700 | $309,600 |
| 2017 | $9,104 | $421,300 | $111,700 | $309,600 |
| 2016 | $9,058 | $421,300 | $111,700 | $309,600 |
| 2015 | $8,856 | $421,300 | $111,700 | $309,600 |
| 2014 | $8,885 | $421,300 | $111,700 | $309,600 |
| 2011 | -- | $434,700 | $111,700 | $323,000 |
Source: Public Records
Map
Nearby Homes
- 27 Buckingham Dr
- 28 Barksdale Ave
- 8 Barksdale Ave
- 17 Welch Rd
- 32 Noyes Rd
- 4 Crestview Cir Unit 119
- 15 Harvey Rd
- 38 Bartley Hill Rd
- 50 Bartley Hill Rd
- 36 Perkins Rd
- 5 Webster Rd
- 193 Fieldstone Dr
- 193 Fieldstone Dr Unit 193
- 118 Fieldstone Dr Unit 118
- 169 Fieldstone Dr
- 10 Auburn Rd
- 35 Red Deer Rd
- 103 Rockingham Rd Unit 1
- 103 Rockingham Rd Unit 2
- 19 Auburn Rd