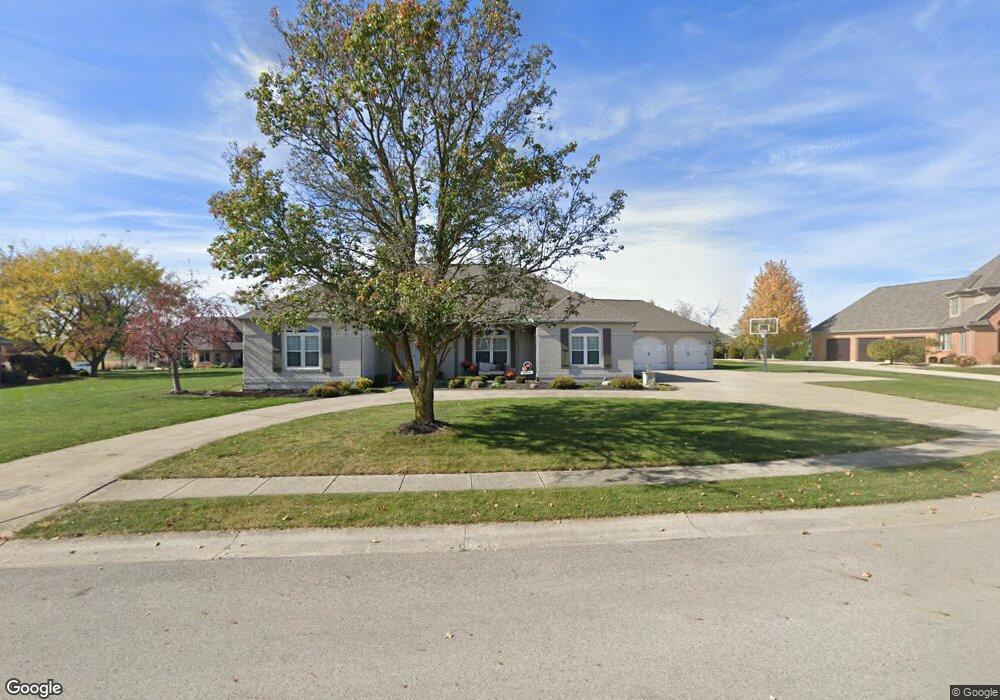
7 Sycamore Ct Minster, OH 45865
Estimated Value: $542,123 - $697,000
3
Beds
3
Baths
2,740
Sq Ft
$217/Sq Ft
Est. Value
About This Home
This home is located at 7 Sycamore Ct, Minster, OH 45865 and is currently estimated at $595,374, approximately $217 per square foot. 7 Sycamore Ct is a home located in Auglaize County with nearby schools including Minster Elementary School and Minster Junior/Senior High School.
Ownership History
Date
Name
Owned For
Owner Type
Purchase Details
Closed on
Feb 6, 2013
Sold by
Burke James P and Burke Susan
Bought by
Niemeyer Matthew R and Niemeyer Alycia L
Current Estimated Value
Home Financials for this Owner
Home Financials are based on the most recent Mortgage that was taken out on this home.
Original Mortgage
$185,250
Outstanding Balance
$127,465
Interest Rate
3.3%
Mortgage Type
New Conventional
Estimated Equity
$467,909
Purchase Details
Closed on
Oct 5, 2007
Sold by
Olding Keith E
Bought by
Burke James P and Burke Susan
Home Financials for this Owner
Home Financials are based on the most recent Mortgage that was taken out on this home.
Original Mortgage
$200,000
Interest Rate
6.55%
Mortgage Type
Purchase Money Mortgage
Purchase Details
Closed on
Aug 31, 1998
Sold by
Piontkowski David J
Bought by
Olding Keith E
Purchase Details
Closed on
Jan 24, 1997
Sold by
Becker Mark William
Bought by
Piontkowski David J
Purchase Details
Closed on
Jun 23, 1992
Bought by
Becker Mark William
Create a Home Valuation Report for This Property
The Home Valuation Report is an in-depth analysis detailing your home's value as well as a comparison with similar homes in the area
Home Values in the Area
Average Home Value in this Area
Purchase History
| Date | Buyer | Sale Price | Title Company |
|---|---|---|---|
| Niemeyer Matthew R | $195,000 | Attorney | |
| Burke James P | $252,500 | Attorney | |
| Olding Keith E | $194,000 | -- | |
| Piontkowski David J | $195,000 | -- | |
| Becker Mark William | $27,000 | -- |
Source: Public Records
Mortgage History
| Date | Status | Borrower | Loan Amount |
|---|---|---|---|
| Open | Niemeyer Matthew R | $185,250 | |
| Closed | Burke James P | $200,000 |
Source: Public Records
Tax History
| Year | Tax Paid | Tax Assessment Tax Assessment Total Assessment is a certain percentage of the fair market value that is determined by local assessors to be the total taxable value of land and additions on the property. | Land | Improvement |
|---|---|---|---|---|
| 2025 | $10,615 | $152,800 | $18,040 | $134,760 |
| 2024 | $10,615 | $152,800 | $18,040 | $134,760 |
| 2023 | $5,158 | $152,800 | $18,040 | $134,760 |
| 2022 | $4,542 | $125,460 | $16,390 | $109,070 |
| 2021 | $4,657 | $125,460 | $16,390 | $109,070 |
| 2020 | $4,415 | $116,494 | $16,394 | $100,100 |
| 2019 | $3,884 | $95,516 | $13,402 | $82,114 |
| 2018 | $3,884 | $95,516 | $13,402 | $82,114 |
| 2017 | $3,602 | $95,516 | $13,402 | $82,114 |
| 2016 | $3,241 | $83,955 | $12,513 | $71,442 |
| 2015 | $3,185 | $83,955 | $12,513 | $71,442 |
| 2014 | $3,189 | $83,955 | $12,513 | $71,442 |
| 2013 | $3,345 | $83,955 | $12,513 | $71,442 |
Source: Public Records
Map
Nearby Homes
- 17 Stonegate Dr
- 31 Melcher St
- 0 Stonegate Dr Unit 14 10544847
- 0 Stonegate Dr Unit 21 10544857
- 36 Shania Place Unit 23
- 28 Shania Place Unit 33
- 19 Shania Place Unit 33
- 27 Shania Place Unit 26
- 193 N Paris St
- 7 E 2nd St
- 561 S Walnut St Unit Lot3
- 315 Mid Lane St
- 217 S Washington St
- 410 E Cherry St
- 312 Margaret St
- 316 Margaret St
- 323 Margaret St
- 424 E Plum St
- 420 E Plum St
- 416 E Plum St
- 5 Sycamore Ct
- 6 Miami Erie Dr
- 9 Sycamore Ct
- 14 Miami Erie Dr
- 4 Miami Erie Dr
- 6 Sycamore Ct
- 14 Sycamore Ct
- 11 Sycamore Ct
- 22 Miami Erie Dr
- 8 Sycamore Ct
- 19 Parkview Dr
- 13 Miami Erie Dr
- 77 Northcrest Dr
- 5 Miami Erie Dr
- 12 Parkview Dr
- 61 Northcrest Dr
- 21 Miami Erie Dr
- 15 Settlers Ln
- 21 Parkview Dr
- 3 Miami Erie Dr