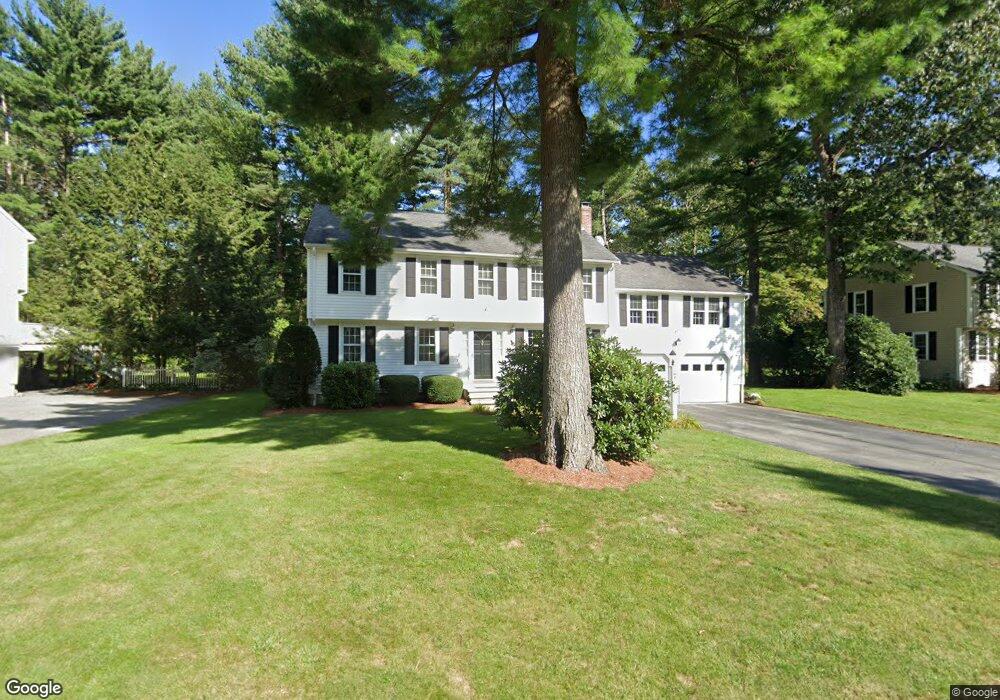
7 Teaberry Ln Andover, MA 01810
Southern Andover NeighborhoodEstimated Value: $1,175,377 - $1,351,000
4
Beds
3
Baths
2,824
Sq Ft
$457/Sq Ft
Est. Value
About This Home
This home is located at 7 Teaberry Ln, Andover, MA 01810 and is currently estimated at $1,290,844, approximately $457 per square foot. 7 Teaberry Ln is a home located in Essex County with nearby schools including South Elementary School, Doherty Middle School, and Andover High School.
Ownership History
Date
Name
Owned For
Owner Type
Purchase Details
Closed on
Feb 22, 2023
Sold by
Hanson Beverly J and Hanson James R
Bought by
Beverly J Hanson Ret and Hanson
Current Estimated Value
Purchase Details
Closed on
Oct 11, 1983
Bought by
Hanson James R and Hanson Beverly J
Create a Home Valuation Report for This Property
The Home Valuation Report is an in-depth analysis detailing your home's value as well as a comparison with similar homes in the area
Home Values in the Area
Average Home Value in this Area
Purchase History
| Date | Buyer | Sale Price | Title Company |
|---|---|---|---|
| Beverly J Hanson Ret | -- | None Available | |
| Beverly J Hanson Ret | -- | None Available | |
| Hanson James R | $145,000 | -- |
Source: Public Records
Mortgage History
| Date | Status | Borrower | Loan Amount |
|---|---|---|---|
| Previous Owner | Hanson James R | $50,000 | |
| Previous Owner | Hanson James R | $105,000 | |
| Previous Owner | Hanson James R | $25,000 |
Source: Public Records
Tax History
| Year | Tax Paid | Tax Assessment Tax Assessment Total Assessment is a certain percentage of the fair market value that is determined by local assessors to be the total taxable value of land and additions on the property. | Land | Improvement |
|---|---|---|---|---|
| 2024 | $12,266 | $952,300 | $445,200 | $507,100 |
| 2023 | $11,472 | $839,800 | $380,600 | $459,200 |
| 2022 | $10,988 | $752,600 | $343,000 | $409,600 |
| 2021 | $10,553 | $690,200 | $312,000 | $378,200 |
| 2020 | $10,267 | $684,000 | $312,000 | $372,000 |
| 2019 | $10,084 | $660,400 | $294,500 | $365,900 |
| 2018 | $9,755 | $623,700 | $286,100 | $337,600 |
| 2017 | $9,369 | $617,200 | $280,600 | $336,600 |
| 2016 | $9,399 | $634,200 | $295,200 | $339,000 |
| 2015 | $9,223 | $616,100 | $295,200 | $320,900 |
Source: Public Records
Map
Nearby Homes
Your Personal Tour Guide
Ask me questions while you tour the home.