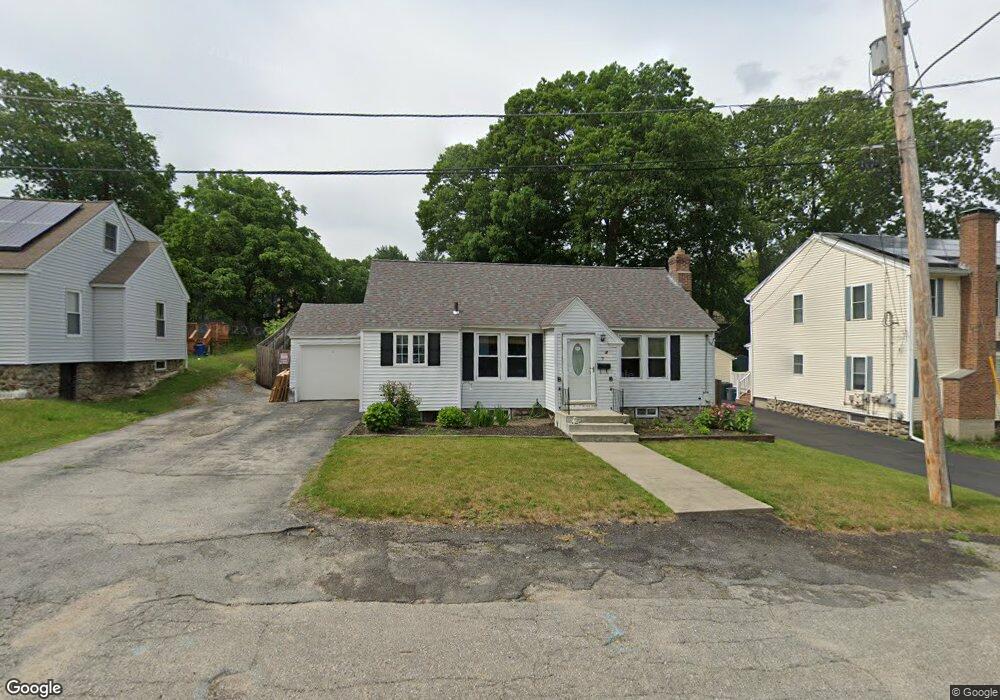
7 Tewksbury Rd Worcester, MA 01602
Webster Square NeighborhoodEstimated Value: $373,000 - $413,000
2
Beds
1
Bath
1,174
Sq Ft
$335/Sq Ft
Est. Value
About This Home
This home is located at 7 Tewksbury Rd, Worcester, MA 01602 and is currently estimated at $393,843, approximately $335 per square foot. 7 Tewksbury Rd is a home located in Worcester County with nearby schools including Chandler Magnet, Jacob Hiatt Magnet School, and May Street Elementary School.
Ownership History
Date
Name
Owned For
Owner Type
Purchase Details
Closed on
Aug 5, 2020
Sold by
Collins Dennis M and Collins Tara A
Bought by
Collins Dennis M
Current Estimated Value
Purchase Details
Closed on
Mar 5, 2004
Sold by
Solomon Judy A
Bought by
Collins Dennis M and Powers Tara A
Home Financials for this Owner
Home Financials are based on the most recent Mortgage that was taken out on this home.
Original Mortgage
$174,500
Interest Rate
5.62%
Mortgage Type
Purchase Money Mortgage
Purchase Details
Closed on
Apr 29, 1997
Sold by
Dwyer Ralph E
Bought by
Solomon Judy A
Create a Home Valuation Report for This Property
The Home Valuation Report is an in-depth analysis detailing your home's value as well as a comparison with similar homes in the area
Home Values in the Area
Average Home Value in this Area
Purchase History
| Date | Buyer | Sale Price | Title Company |
|---|---|---|---|
| Collins Dennis M | -- | None Available | |
| Collins Dennis M | -- | None Available | |
| Collins Dennis M | $180,000 | -- | |
| Collins Dennis M | $180,000 | -- | |
| Solomon Judy A | $85,500 | -- | |
| Solomon Judy A | $85,500 | -- |
Source: Public Records
Mortgage History
| Date | Status | Borrower | Loan Amount |
|---|---|---|---|
| Previous Owner | Solomon Judy A | $161,500 | |
| Previous Owner | Collins Dennis M | $174,500 |
Source: Public Records
Tax History Compared to Growth
Tax History
| Year | Tax Paid | Tax Assessment Tax Assessment Total Assessment is a certain percentage of the fair market value that is determined by local assessors to be the total taxable value of land and additions on the property. | Land | Improvement |
|---|---|---|---|---|
| 2025 | $3,874 | $293,700 | $97,800 | $195,900 |
| 2024 | $3,805 | $276,700 | $97,800 | $178,900 |
| 2023 | $3,641 | $253,900 | $85,000 | $168,900 |
| 2022 | $3,329 | $218,900 | $68,000 | $150,900 |
| 2021 | $3,108 | $190,900 | $54,400 | $136,500 |
| 2020 | $3,023 | $177,800 | $54,000 | $123,800 |
| 2019 | $2,851 | $158,400 | $47,200 | $111,200 |
| 2018 | $2,865 | $151,500 | $47,200 | $104,300 |
| 2017 | $2,747 | $142,900 | $47,200 | $95,700 |
| 2016 | $2,661 | $129,100 | $33,400 | $95,700 |
| 2015 | $2,591 | $129,100 | $33,400 | $95,700 |
| 2014 | $2,523 | $129,100 | $33,400 | $95,700 |
Source: Public Records
Map
Nearby Homes
- 5 Swan Ave
- 45 Fourth St
- 45 Fourth St Unit Right
- 47 4th St
- 41 Walnut Hill Dr
- 5 Amber St
- 415 Mill St
- 57 1st St
- 71 Glendale St
- 250 May St
- 15 Circuit Ave E
- 19 Monticello Dr
- 47R Yarnie Unit 3B
- 47R Yarnie Unit 3A
- 47R Yarnie Unit 1B
- 47R Yarnie Unit 2B
- 47R Yarnie Unit 4B
- 47R Yarnie Unit 8B
- 47R Yarnie Unit 5A
- 47R Yarnie Unit 6B
- 5 Tewksbury Rd
- 9 Tewksbury Rd
- 8 Sweetbriar Ln
- 6 Sweetbriar Ln
- 10 Sweetbriar Ln
- 340 Mill St
- 338 Mill St
- 8 Tewksbury Rd
- 12 Sweetbriar Ln
- 10 Tewksbury Rd
- 342 Mill St
- 6 Tewksbury Rd
- 334 Mill St
- 344 Mill St
- 332 Mill St
- 9 Sweetbriar Ln
- 7 Sweetbriar Ln
- 8 Merriweather Rd
- 10 Merriweather Rd
- 6 Merriweather Rd