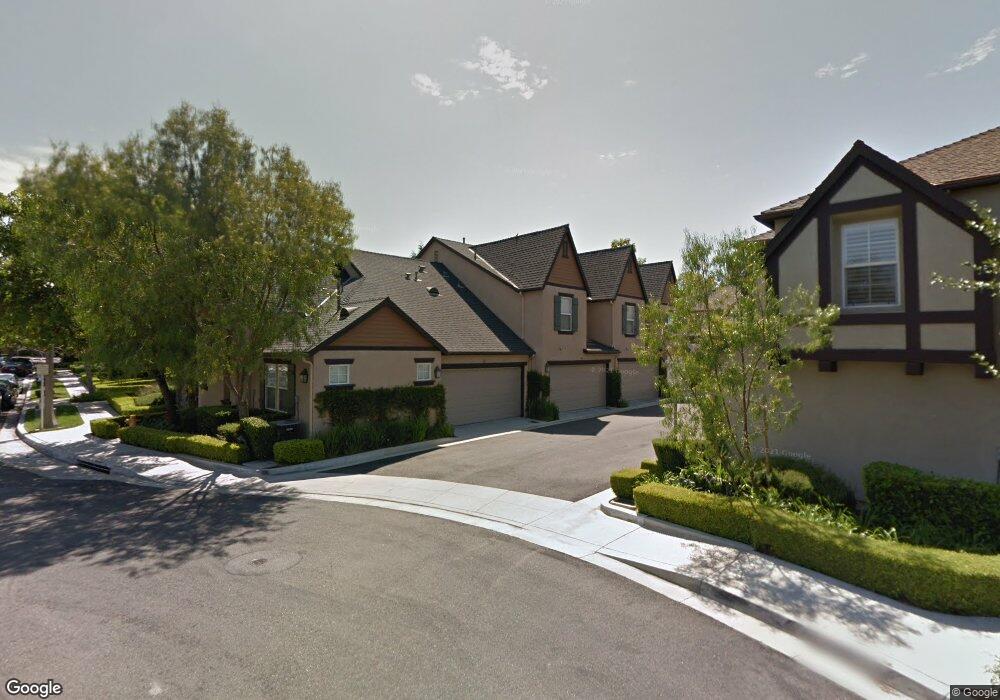
7 Three Vines Ct Unit 2904 Ladera Ranch, CA 92694
Estimated Value: $868,000 - $894,000
3
Beds
2
Baths
1,376
Sq Ft
$643/Sq Ft
Est. Value
About This Home
This home is located at 7 Three Vines Ct Unit 2904, Ladera Ranch, CA 92694 and is currently estimated at $884,626, approximately $642 per square foot. 7 Three Vines Ct Unit 2904 is a home located in Orange County with nearby schools including Chaparral Elementary School, Ladera Ranch Middle School, and Tesoro High School.
Ownership History
Date
Name
Owned For
Owner Type
Purchase Details
Closed on
May 23, 2002
Sold by
Gillian Kevin D and Gillian Holly E
Bought by
Sheldon Edwin Craig and Sheldon Tracey M
Current Estimated Value
Home Financials for this Owner
Home Financials are based on the most recent Mortgage that was taken out on this home.
Original Mortgage
$244,000
Outstanding Balance
$108,011
Interest Rate
7.62%
Estimated Equity
$776,615
Purchase Details
Closed on
Mar 6, 2001
Sold by
Centex Homes
Bought by
Gillian Kevin D and Gillian Holly E
Home Financials for this Owner
Home Financials are based on the most recent Mortgage that was taken out on this home.
Original Mortgage
$224,650
Interest Rate
7.06%
Create a Home Valuation Report for This Property
The Home Valuation Report is an in-depth analysis detailing your home's value as well as a comparison with similar homes in the area
Home Values in the Area
Average Home Value in this Area
Purchase History
| Date | Buyer | Sale Price | Title Company |
|---|---|---|---|
| Sheldon Edwin Craig | $305,000 | United Title Company | |
| Gillian Kevin D | $237,000 | Benefit Land Title Company |
Source: Public Records
Mortgage History
| Date | Status | Borrower | Loan Amount |
|---|---|---|---|
| Open | Sheldon Edwin Craig | $244,000 | |
| Previous Owner | Gillian Kevin D | $224,650 |
Source: Public Records
Tax History Compared to Growth
Tax History
| Year | Tax Paid | Tax Assessment Tax Assessment Total Assessment is a certain percentage of the fair market value that is determined by local assessors to be the total taxable value of land and additions on the property. | Land | Improvement |
|---|---|---|---|---|
| 2025 | $5,906 | $450,567 | $271,720 | $178,847 |
| 2024 | $5,906 | $441,733 | $266,392 | $175,341 |
| 2023 | $5,816 | $433,072 | $261,169 | $171,903 |
| 2022 | $5,726 | $424,581 | $256,048 | $168,533 |
| 2021 | $5,644 | $416,256 | $251,027 | $165,229 |
| 2020 | $5,562 | $411,988 | $248,453 | $163,535 |
| 2019 | $5,604 | $403,910 | $243,581 | $160,329 |
| 2018 | $5,568 | $395,991 | $238,805 | $157,186 |
| 2017 | $5,616 | $388,227 | $234,123 | $154,104 |
| 2016 | $5,557 | $380,615 | $229,532 | $151,083 |
| 2015 | $5,593 | $374,898 | $226,084 | $148,814 |
| 2014 | $5,621 | $367,555 | $221,656 | $145,899 |
Source: Public Records
Map
Nearby Homes
- 23 Three Vines Ct
- 43 Three Vines Ct
- 30 Three Vines Ct
- 80 Three Vines Ct
- 27 Ardennes Dr
- 12 Ardennes Dr
- 81 Mercantile Way
- 4 Hearthside Rd
- 28 Albany St Unit 77
- 22 Kingsway Dr
- 14 Downing St
- 18 Beacon Point
- 15 Keystone Dr
- 4 Potters Bend
- 5 Flowerdale Unit 104
- 9 Baudin Cir
- 30 Baudin Cir
- 246 Sunstone Place
- 5176 Solance Dr
- 18811 Volta Rd
- 5 Three Vines Ct
- 3 Three Vines Ct
- 11 Three Vines Ct
- 1 Three Vines Ct Unit 2901
- 21 Three Vines Ct
- 17 Three Vines Ct
- 15 Three Vines Ct Unit 2701
- 19 Three Vines Ct
- 25 Three Vines Ct
- 9 Three Vines Ct
- 31 Three Vines Ct
- 33 Three Vines Ct Unit 2104
- 8 3 Vines Ct
- 29 Three Vines Ct
- 37 Three Vines Ct
- 27 Three Vines Ct
- 2 Three Vines Ct
- 6 Three Vines Ct
- 18 Three Vines Ct
- 22 Three Vines Ct