7 Tilton Rd Northfield, NH 03276
Tilton NeighborhoodEstimated Value: $6,115,796
2
Beds
2
Baths
1,512
Sq Ft
$4,045/Sq Ft
Est. Value
About This Home
This home is located at 7 Tilton Rd, Northfield, NH 03276 and is currently estimated at $6,115,796, approximately $4,044 per square foot. 7 Tilton Rd is a home located in Belknap County with nearby schools including Union Sanborn School, Sanbornton Central School, and Winnisquam Regional Middle School.
Ownership History
Date
Name
Owned For
Owner Type
Purchase Details
Closed on
Aug 11, 2016
Sold by
Harshida Llc
Bought by
Vasudev Hospitality Ll
Current Estimated Value
Purchase Details
Closed on
Feb 11, 2011
Sold by
Shivum Llc
Bought by
Harshida Llc
Home Financials for this Owner
Home Financials are based on the most recent Mortgage that was taken out on this home.
Original Mortgage
$1,350,000
Interest Rate
4.88%
Mortgage Type
Commercial
Create a Home Valuation Report for This Property
The Home Valuation Report is an in-depth analysis detailing your home's value as well as a comparison with similar homes in the area
Home Values in the Area
Average Home Value in this Area
Purchase History
| Date | Buyer | Sale Price | Title Company |
|---|---|---|---|
| Vasudev Hospitality Ll | $2,800,000 | -- | |
| Harshida Llc | $2,674,700 | -- |
Source: Public Records
Mortgage History
| Date | Status | Borrower | Loan Amount |
|---|---|---|---|
| Previous Owner | Harshida Llc | $1,350,000 | |
| Previous Owner | Harshida Llc | $968,000 |
Source: Public Records
Tax History Compared to Growth
Tax History
| Year | Tax Paid | Tax Assessment Tax Assessment Total Assessment is a certain percentage of the fair market value that is determined by local assessors to be the total taxable value of land and additions on the property. | Land | Improvement |
|---|---|---|---|---|
| 2024 | $36,692 | $3,397,400 | $1,092,800 | $2,304,600 |
| 2023 | $46,041 | $2,599,700 | $706,300 | $1,893,400 |
| 2022 | $39,666 | $2,468,300 | $706,300 | $1,762,000 |
| 2021 | $40,381 | $2,468,300 | $706,300 | $1,762,000 |
| 2020 | $45,590 | $2,468,300 | $706,300 | $1,762,000 |
| 2019 | $48,403 | $2,468,300 | $706,300 | $1,762,000 |
| 2018 | $43,590 | $1,952,100 | $678,800 | $1,273,300 |
| 2017 | $41,970 | $1,952,100 | $678,800 | $1,273,300 |
| 2016 | $39,470 | $1,904,900 | $678,800 | $1,226,100 |
| 2015 | $43,756 | $1,904,900 | $678,800 | $1,226,100 |
| 2014 | $37,927 | $1,904,900 | $678,800 | $1,226,100 |
| 2013 | $36,684 | $2,004,600 | $778,500 | $1,226,100 |
| 2012 | $36,584 | $2,004,600 | $778,500 | $1,226,100 |
Source: Public Records
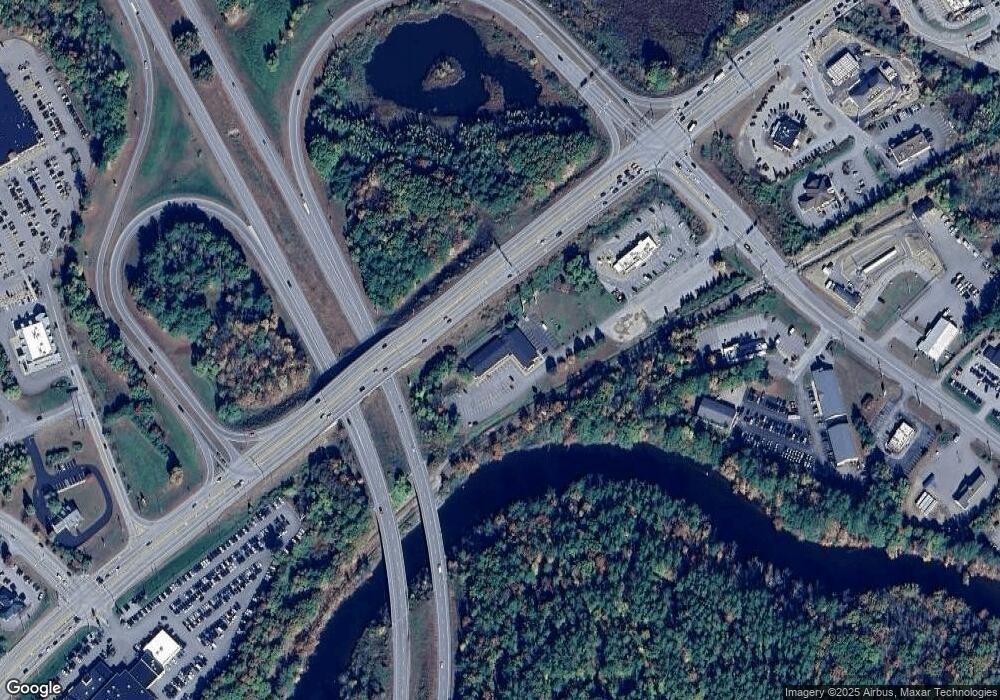
Map
Nearby Homes