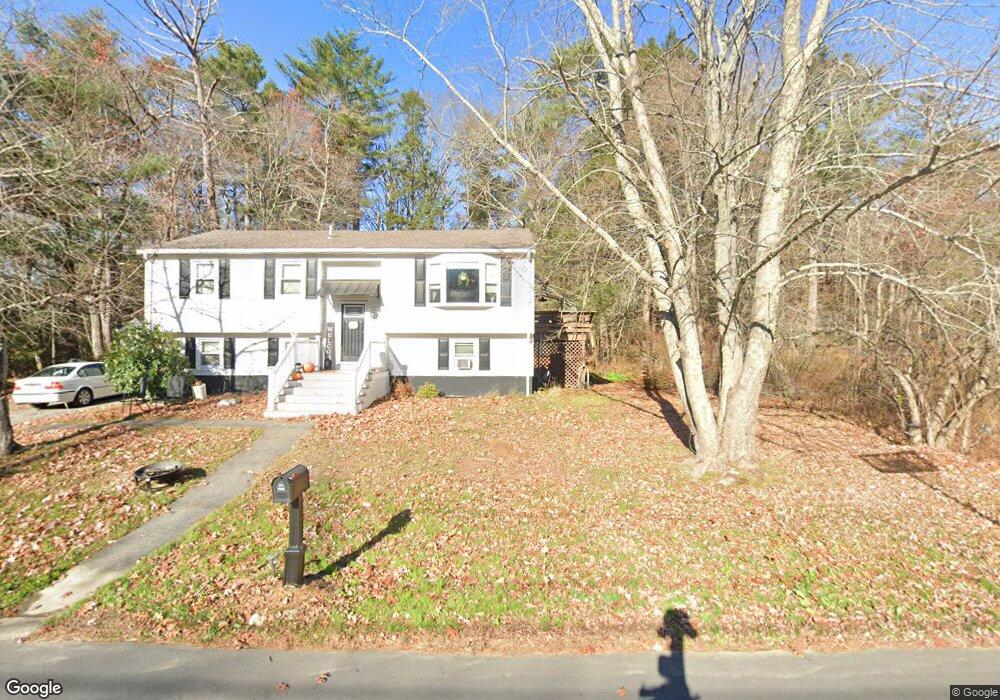
7 Toll Road Extention Salisbury, MA 01952
Estimated Value: $1,275,000 - $1,828,367
Studio
--
Bath
--
Sq Ft
1,647,875
Sq Ft Lot
About This Home
This home is located at 7 Toll Road Extention, Salisbury, MA 01952 and is currently estimated at $1,613,592. 7 Toll Road Extention is a home located in Essex County with nearby schools including Triton Regional High School.
Ownership History
Date
Name
Owned For
Owner Type
Purchase Details
Closed on
Jan 13, 2006
Sold by
Forest Road Llc
Bought by
Clark Duncan O and Clark Maryann D
Current Estimated Value
Home Financials for this Owner
Home Financials are based on the most recent Mortgage that was taken out on this home.
Original Mortgage
$285,700
Interest Rate
6.31%
Purchase Details
Closed on
Mar 4, 2005
Sold by
Deluca Pasqualina and Deluca Ralph D
Bought by
Forest Road Llc
Purchase Details
Closed on
Aug 8, 2003
Sold by
Est Jones Otis S and Musgrove Joan M
Bought by
Deluca Ralph D and Deluca Daniel
Create a Home Valuation Report for This Property
The Home Valuation Report is an in-depth analysis detailing your home's value as well as a comparison with similar homes in the area
Home Values in the Area
Average Home Value in this Area
Purchase History
| Date | Buyer | Sale Price | Title Company |
|---|---|---|---|
| Clark Duncan O | $489,900 | -- | |
| Forest Road Llc | $150,000 | -- | |
| Deluca Ralph D | $425,000 | -- |
Source: Public Records
Mortgage History
| Date | Status | Borrower | Loan Amount |
|---|---|---|---|
| Open | Deluca Ralph D | $276,000 | |
| Closed | Deluca Ralph D | $50,000 | |
| Closed | Deluca Ralph D | $285,700 | |
| Open | Deluca Ralph D | $489,900 |
Source: Public Records
Tax History
| Year | Tax Paid | Tax Assessment Tax Assessment Total Assessment is a certain percentage of the fair market value that is determined by local assessors to be the total taxable value of land and additions on the property. | Land | Improvement |
|---|---|---|---|---|
| 2025 | $6,707 | $665,400 | $665,400 | $0 |
| 2024 | $6,953 | $665,400 | $665,400 | $0 |
| 2023 | $7,186 | $665,400 | $665,400 | $0 |
| 2022 | $7,219 | $648,000 | $648,000 | $0 |
| 2021 | $7,296 | $648,000 | $648,000 | $0 |
| 2020 | $7,426 | $648,000 | $648,000 | $0 |
| 2019 | $4,610 | $388,700 | $388,700 | $0 |
| 2018 | $4,501 | $382,100 | $382,100 | $0 |
| 2017 | $4,373 | $366,900 | $366,900 | $0 |
| 2016 | $4,230 | $362,500 | $362,500 | $0 |
| 2015 | $4,157 | $353,800 | $353,800 | $0 |
Source: Public Records
Map
Nearby Homes
- 7 Toll Rd
- 25 Bayberry Ln
- 154 Lafayette Rd
- 188 Lafayette Rd
- 42 Kendell Ln
- 57 Baker Rd
- 2 True Rd
- 241 & 245 Lafayette Rd
- 53 Rabbit Rd
- 35 Brooks Rd Unit 1
- 6 Janvrin Dr
- 55 Lafayette Rd
- 6 Mason Ln
- 14 Seabrook Rd
- 9 Meadowview Ln Unit A
- 14 Meadowview Ln Unit B
- 16 Meadowview Ln Unit B
- 82 Monroe St
- 44 Seabrook Rd
- 191 Elm St
Your Personal Tour Guide
Ask me questions while you tour the home.