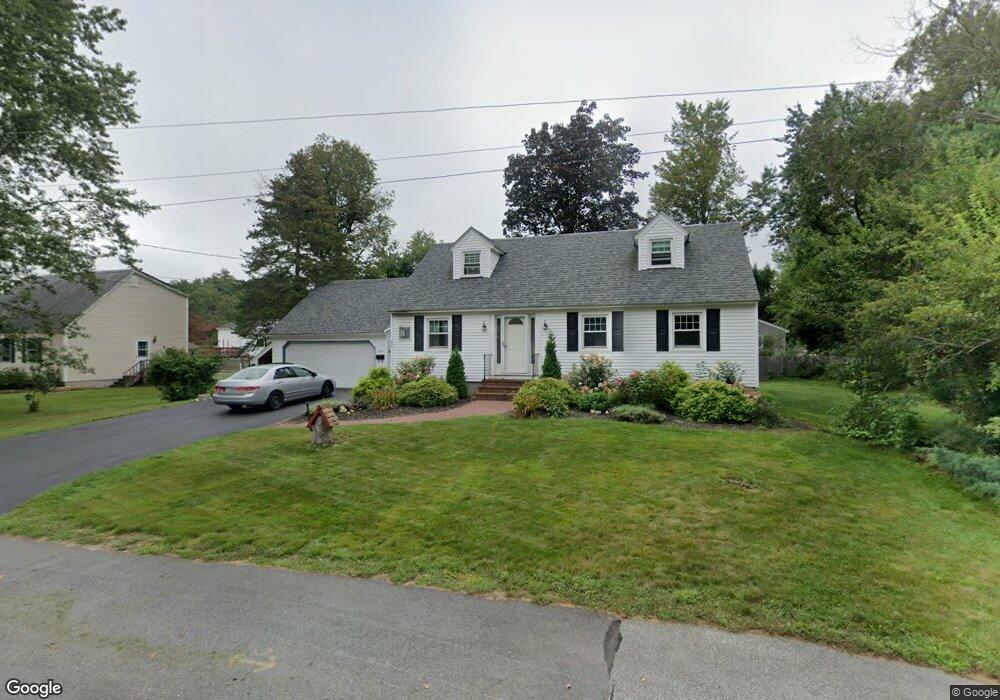
7 Trinity St Concord, NH 03301
South End NeighborhoodEstimated Value: $444,000 - $610,000
3
Beds
2
Baths
1,966
Sq Ft
$276/Sq Ft
Est. Value
About This Home
This home is located at 7 Trinity St, Concord, NH 03301 and is currently estimated at $542,147, approximately $275 per square foot. 7 Trinity St is a home located in Merrimack County with nearby schools including Abbot-Downing School, Rundlett Middle School, and Concord High School.
Ownership History
Date
Name
Owned For
Owner Type
Purchase Details
Closed on
Jan 8, 2025
Sold by
Andrew Jane F
Bought by
Warren Andrew Ft and Andrew
Current Estimated Value
Purchase Details
Closed on
May 31, 2018
Sold by
Braunstein Mira M
Bought by
Andrew Jane F and Andrew Warren D
Purchase Details
Closed on
Dec 7, 2016
Sold by
Braunstein Leonard Ret and Braunstein
Bought by
Braunstein Mira M
Create a Home Valuation Report for This Property
The Home Valuation Report is an in-depth analysis detailing your home's value as well as a comparison with similar homes in the area
Home Values in the Area
Average Home Value in this Area
Purchase History
| Date | Buyer | Sale Price | Title Company |
|---|---|---|---|
| Warren Andrew Ft | -- | None Available | |
| Warren Andrew Ft | -- | None Available | |
| Andrew Jane F | $195,000 | -- | |
| Andrew Jane F | $195,000 | -- | |
| Braunstein Mira M | -- | -- | |
| Braunstein Mira M | -- | -- |
Source: Public Records
Tax History Compared to Growth
Tax History
| Year | Tax Paid | Tax Assessment Tax Assessment Total Assessment is a certain percentage of the fair market value that is determined by local assessors to be the total taxable value of land and additions on the property. | Land | Improvement |
|---|---|---|---|---|
| 2024 | $9,797 | $353,800 | $123,300 | $230,500 |
| 2023 | $9,503 | $353,800 | $123,300 | $230,500 |
| 2022 | $9,160 | $353,800 | $123,300 | $230,500 |
| 2021 | $8,887 | $353,800 | $123,300 | $230,500 |
| 2020 | $8,582 | $320,700 | $97,000 | $223,700 |
| 2019 | $8,170 | $294,100 | $100,800 | $193,300 |
| 2018 | $7,924 | $281,100 | $101,200 | $179,900 |
| 2017 | $8,164 | $289,100 | $101,200 | $187,900 |
| 2016 | $7,667 | $277,100 | $99,100 | $178,000 |
| 2015 | $7,368 | $269,000 | $107,600 | $161,400 |
| 2014 | $7,212 | $269,000 | $107,600 | $161,400 |
| 2013 | -- | $265,900 | $107,600 | $158,300 |
| 2012 | -- | $264,900 | $113,300 | $151,600 |
Source: Public Records
Map
Nearby Homes
- 0 South St Unit 4969509
- 5 Broad Ave
- 1 Kensington Rd
- 1 Matthew St Unit 6
- 47 South St
- 0 Spruce St Unit 88
- 24 Pierce St
- 33 Spruce St
- 105 S Main St
- 26 South St
- 4 N Spring St
- 69 Centre St
- 128 Liberty St
- 24 Hazel Dr
- 22 Longmeadow Dr
- 55 Tremont St
- 30 Jackson St
- 11 Washington St
- 7 Highridge Trail
- 157 Rumford St