Estimated Value: $1,300,373 - $1,371,000
3
Beds
2
Baths
1,501
Sq Ft
$890/Sq Ft
Est. Value
About This Home
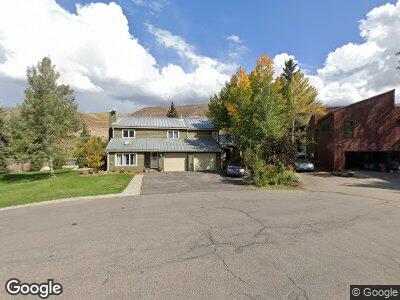
This home is located at 7 W Deer Blvd Unit B, Avon, CO 81620 and is currently estimated at $1,335,343, approximately $889 per square foot. 7 W Deer Blvd Unit B is a home located in Eagle County with nearby schools including Homestake Peak School and Battle Mountain High School.
Ownership History
Date
Name
Owned For
Owner Type
Purchase Details
Closed on
Jul 30, 2021
Sold by
Garner Michele K
Bought by
Nesline Mark and Lewis Stephanie
Current Estimated Value
Home Financials for this Owner
Home Financials are based on the most recent Mortgage that was taken out on this home.
Original Mortgage
$600,000
Outstanding Balance
$552,174
Interest Rate
3%
Mortgage Type
New Conventional
Estimated Equity
$783,169
Purchase Details
Closed on
May 6, 2009
Sold by
Garner Roger Allen and Allen Garner R
Bought by
Garner Michele K
Purchase Details
Closed on
Mar 7, 2005
Sold by
Cook Craig Charles and Cook Wendy Darrow
Bought by
Garner Michele K and Allen Garner R
Home Financials for this Owner
Home Financials are based on the most recent Mortgage that was taken out on this home.
Original Mortgage
$318,400
Interest Rate
4.62%
Mortgage Type
New Conventional
Create a Home Valuation Report for This Property
The Home Valuation Report is an in-depth analysis detailing your home's value as well as a comparison with similar homes in the area
Home Values in the Area
Average Home Value in this Area
Purchase History
| Date | Buyer | Sale Price | Title Company |
|---|---|---|---|
| Nesline Mark | $860,000 | Land Title Guarantee | |
| Garner Michele K | -- | None Available | |
| Garner Michele K | $398,000 | Land Title Guarantee Company |
Source: Public Records
Mortgage History
| Date | Status | Borrower | Loan Amount |
|---|---|---|---|
| Open | Nesline Mark | $600,000 | |
| Previous Owner | Garner Michele K | $340,000 | |
| Previous Owner | Garner Michele K | $296,000 | |
| Previous Owner | Garner Michele K | $59,700 | |
| Previous Owner | Garner Michele K | $318,400 | |
| Closed | Garner Michele K | $59,700 |
Source: Public Records
Tax History Compared to Growth
Tax History
| Year | Tax Paid | Tax Assessment Tax Assessment Total Assessment is a certain percentage of the fair market value that is determined by local assessors to be the total taxable value of land and additions on the property. | Land | Improvement |
|---|---|---|---|---|
| 2024 | $4,126 | $67,180 | $16,860 | $50,320 |
| 2023 | $4,126 | $67,180 | $16,860 | $50,320 |
| 2022 | $3,427 | $46,030 | $12,200 | $33,830 |
| 2021 | $3,403 | $47,350 | $12,550 | $34,800 |
| 2020 | $2,936 | $40,400 | $12,550 | $27,850 |
| 2019 | $2,922 | $40,400 | $12,550 | $27,850 |
| 2018 | $2,611 | $35,070 | $7,940 | $27,130 |
| 2017 | $2,584 | $35,070 | $7,940 | $27,130 |
| 2016 | $2,500 | $33,420 | $8,800 | $24,620 |
| 2015 | -- | $33,420 | $8,800 | $24,620 |
| 2014 | $1,812 | $25,410 | $6,810 | $18,600 |
Source: Public Records
Map
Nearby Homes
- 358 Stone Creek Dr Unit 1
- 790 Stone Creek Dr Unit 1
- 790 Stone Creek Dr Unit 4
- 258 Deer Blvd Unit B
- 282 Elk Ln Unit 2
- 54 Columbine Cir Unit C20
- 54 Columbine Cir Unit 15
- 142 Eagle Dr Unit 3
- 411 Eagle Dr Unit 5
- 225 Eagle Dr Unit 9C
- 225 Eagle Dr
- 405 Greenwaye Cir Unit 11-A
- 314 Eagle Rd Unit A-4
- 100 Goldfinch Ln Unit 2A
- 200 Goldfinch Ln Unit 1B
- 200 Goldfinch Ln Unit 1C
- 155 Goldfinch Ln Unit 3D
- 155 Goldfinch Ln Unit 3B
- 205 Kestrel Dr Unit 6A
- 225 Daisy Ln
- 1 Deer Blvd Unit N
- 114 Deer Blvd W 1 2
- 7 W Deer Blvd Unit B
- 1 Deer Blvd Unit S
- 7 W Deer Blvd
- 114 W 1 2 Deer Blvd
- 1 Deer Blvd
- 7 W Deer Blvd Unit A
- 8 Deer Blvd
- 86 Deer Blvd Unit A
- 86 Deer Blvd Unit B
- 86 Deer Blvd
- 0081 Deer Blvd
- 18 Deer Blvd
- 38 Deer Blvd
- 83 Coyote Cir
- 87 Coyote Cir
- 332 Larkspur Ln
- 332 Larkspur Ln Unit West
- 52 Deer Blvd