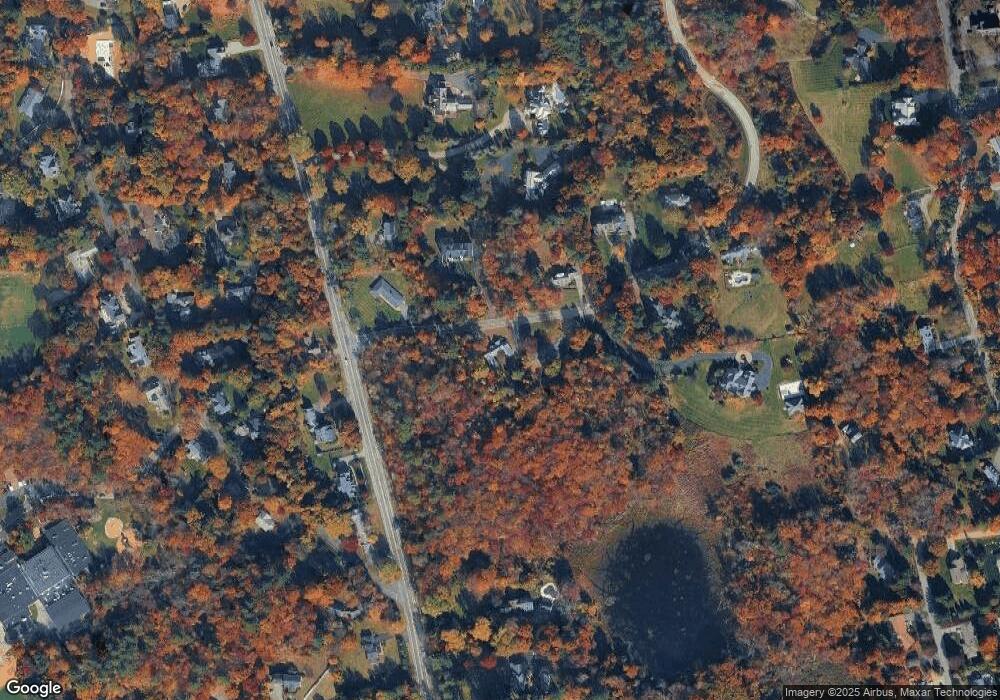
7 W Knoll Rd Andover, MA 01810
Phillips Academy NeighborhoodEstimated Value: $1,112,000 - $1,402,000
3
Beds
3
Baths
2,405
Sq Ft
$532/Sq Ft
Est. Value
About This Home
This home is located at 7 W Knoll Rd, Andover, MA 01810 and is currently estimated at $1,280,010, approximately $532 per square foot. 7 W Knoll Rd is a home located in Essex County with nearby schools including Bancroft Elementary School, Doherty Middle School, and Andover High School.
Ownership History
Date
Name
Owned For
Owner Type
Purchase Details
Closed on
Nov 2, 2022
Sold by
Fox Jeffrey R and Fox Marjorie
Bought by
Fox Marjorie
Current Estimated Value
Purchase Details
Closed on
Sep 16, 1996
Sold by
Connolly Mark S
Bought by
Fox Jeffrey R
Home Financials for this Owner
Home Financials are based on the most recent Mortgage that was taken out on this home.
Original Mortgage
$50,000
Interest Rate
8.22%
Purchase Details
Closed on
Nov 25, 1991
Sold by
Anderson Esther E
Bought by
Connolly Mark S
Create a Home Valuation Report for This Property
The Home Valuation Report is an in-depth analysis detailing your home's value as well as a comparison with similar homes in the area
Home Values in the Area
Average Home Value in this Area
Purchase History
| Date | Buyer | Sale Price | Title Company |
|---|---|---|---|
| Fox Marjorie | -- | None Available | |
| Fox Marjorie | -- | None Available | |
| Fox Jeffrey R | $242,500 | -- | |
| Fox Jeffrey R | $242,500 | -- | |
| Connolly Mark S | $95,000 | -- | |
| Connolly Mark S | $95,000 | -- | |
| Connolly Mark S | $95,000 | -- |
Source: Public Records
Mortgage History
| Date | Status | Borrower | Loan Amount |
|---|---|---|---|
| Previous Owner | Connolly Mark S | $95,000 | |
| Previous Owner | Connolly Mark S | $50,000 | |
| Previous Owner | Connolly Mark S | $72,000 |
Source: Public Records
Tax History Compared to Growth
Tax History
| Year | Tax Paid | Tax Assessment Tax Assessment Total Assessment is a certain percentage of the fair market value that is determined by local assessors to be the total taxable value of land and additions on the property. | Land | Improvement |
|---|---|---|---|---|
| 2024 | $13,836 | $1,074,200 | $711,700 | $362,500 |
| 2023 | $13,228 | $968,400 | $641,300 | $327,100 |
| 2022 | $12,267 | $840,200 | $557,600 | $282,600 |
| 2021 | $11,720 | $766,500 | $506,800 | $259,700 |
| 2020 | $11,235 | $748,500 | $494,400 | $254,100 |
| 2019 | $11,107 | $727,400 | $479,900 | $247,500 |
| 2018 | $10,778 | $689,100 | $461,300 | $227,800 |
| 2017 | $10,298 | $678,400 | $452,500 | $225,900 |
| 2016 | $10,054 | $678,400 | $452,500 | $225,900 |
| 2015 | $9,705 | $648,300 | $435,200 | $213,100 |
Source: Public Records
Map
Nearby Homes