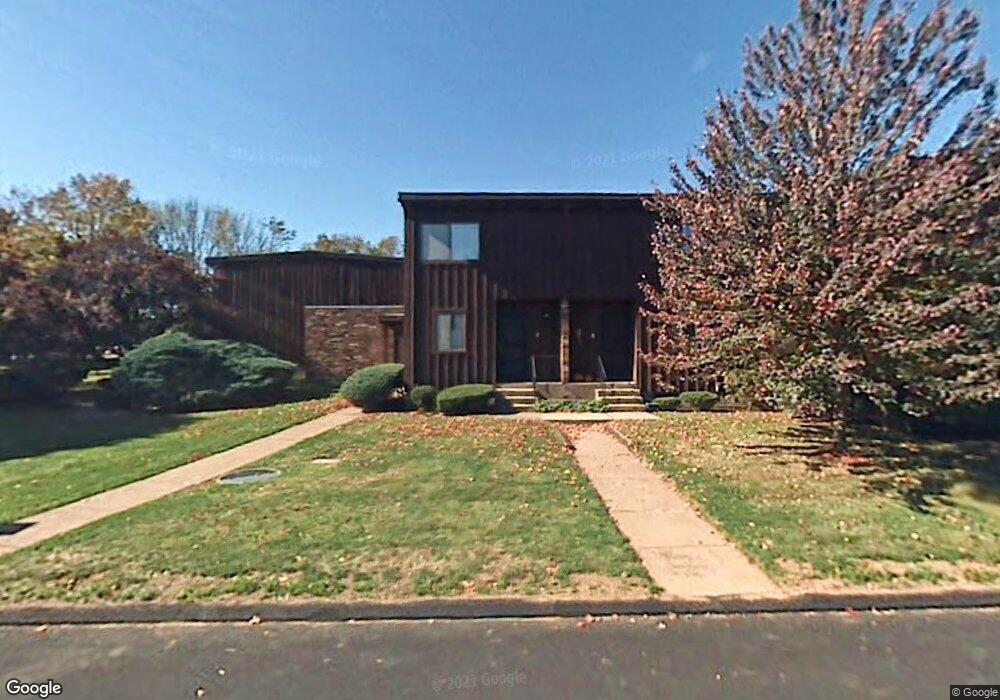
7 Webster Ct Newington, CT 06111
Estimated Value: $230,000 - $265,103
2
Beds
2
Baths
1,094
Sq Ft
$220/Sq Ft
Est. Value
About This Home
This home is located at 7 Webster Ct, Newington, CT 06111 and is currently estimated at $240,276, approximately $219 per square foot. 7 Webster Ct is a home located in Hartford County with nearby schools including John Paterson School, John Wallace Middle School, and Newington High School.
Ownership History
Date
Name
Owned For
Owner Type
Purchase Details
Closed on
May 21, 2025
Sold by
Raineault Stacey E
Bought by
Deleon Katy E
Current Estimated Value
Home Financials for this Owner
Home Financials are based on the most recent Mortgage that was taken out on this home.
Original Mortgage
$207,000
Outstanding Balance
$206,076
Interest Rate
6.62%
Mortgage Type
Purchase Money Mortgage
Estimated Equity
$34,200
Purchase Details
Closed on
Jul 25, 2014
Sold by
Atkins Sumner and Atkins Carolyn
Bought by
King Stacey E
Home Financials for this Owner
Home Financials are based on the most recent Mortgage that was taken out on this home.
Original Mortgage
$140,409
Interest Rate
4.37%
Mortgage Type
FHA
Purchase Details
Closed on
Dec 22, 2003
Sold by
Garber Marvin J and Garber Marian T
Bought by
Atkins Summer and Atkins Carolyn
Create a Home Valuation Report for This Property
The Home Valuation Report is an in-depth analysis detailing your home's value as well as a comparison with similar homes in the area
Home Values in the Area
Average Home Value in this Area
Purchase History
| Date | Buyer | Sale Price | Title Company |
|---|---|---|---|
| Deleon Katy E | $230,000 | None Available | |
| Deleon Katy E | $230,000 | None Available | |
| King Stacey E | $143,000 | -- | |
| King Stacey E | $143,000 | -- | |
| Atkins Summer | $120,000 | -- | |
| Atkins Summer | $120,000 | -- |
Source: Public Records
Mortgage History
| Date | Status | Borrower | Loan Amount |
|---|---|---|---|
| Open | Deleon Katy E | $207,000 | |
| Closed | Deleon Katy E | $207,000 | |
| Previous Owner | Atkins Summer | $150,367 | |
| Previous Owner | King Stacey E | $140,409 |
Source: Public Records
Tax History Compared to Growth
Tax History
| Year | Tax Paid | Tax Assessment Tax Assessment Total Assessment is a certain percentage of the fair market value that is determined by local assessors to be the total taxable value of land and additions on the property. | Land | Improvement |
|---|---|---|---|---|
| 2025 | $3,311 | $82,810 | $0 | $82,810 |
| 2024 | $3,686 | $92,910 | $0 | $92,910 |
| 2023 | $3,564 | $92,910 | $0 | $92,910 |
| 2022 | $3,576 | $92,910 | $0 | $92,910 |
| 2021 | $3,606 | $92,910 | $0 | $92,910 |
| 2020 | $3,776 | $96,130 | $0 | $96,130 |
| 2019 | $3,792 | $96,130 | $0 | $96,130 |
| 2018 | $3,701 | $96,130 | $0 | $96,130 |
| 2017 | $3,517 | $96,130 | $0 | $96,130 |
| 2016 | $3,437 | $96,130 | $0 | $96,130 |
| 2014 | $3,113 | $89,520 | $0 | $89,520 |
Source: Public Records
Map
Nearby Homes
- 660/674 Church Rear St
- 78 Apple Hill
- 19 Sunnybrook Dr
- 9 Coachmen Ln
- 53 Salem Dr
- 44 Trotter Ln
- 28 Kelsey St
- 61 Long St
- 516 Wethersfield Rd
- 212 Church St
- 57 Stonehedge Dr
- 277 Orchard Ave
- 26 Pickens Dr
- 0 Country Ct Unit 134 24089873
- 0 Country Ct Unit 137 24077628
- 43 Steeplechase Dr Unit 43
- 500 Holly Hill Dr
- 149 Foxboro Dr Unit 149
- 120 Fox Run Ct
- 24 Pine Meadow Rd
- 8 Webster Ct
- 8 Webster Ct Unit 8
- 9 Webster Ct
- 9 Webster Ct Unit 9
- 5 Webster Ct
- 10 Webster Ct
- 6 Webster Ct
- 3 Webster Ct
- 11 Webster Ct
- 4 Webster Ct
- 4 Webster Ct Unit 4
- 12 Webster Ct
- 12 Webster Ct Unit 12
- 1 Webster Ct
- 2 Webster Ct
- 131 Webster Ct
- 129 Webster Ct
- 133 Webster Ct
- 130 Webster Ct
- 132 Webster Ct