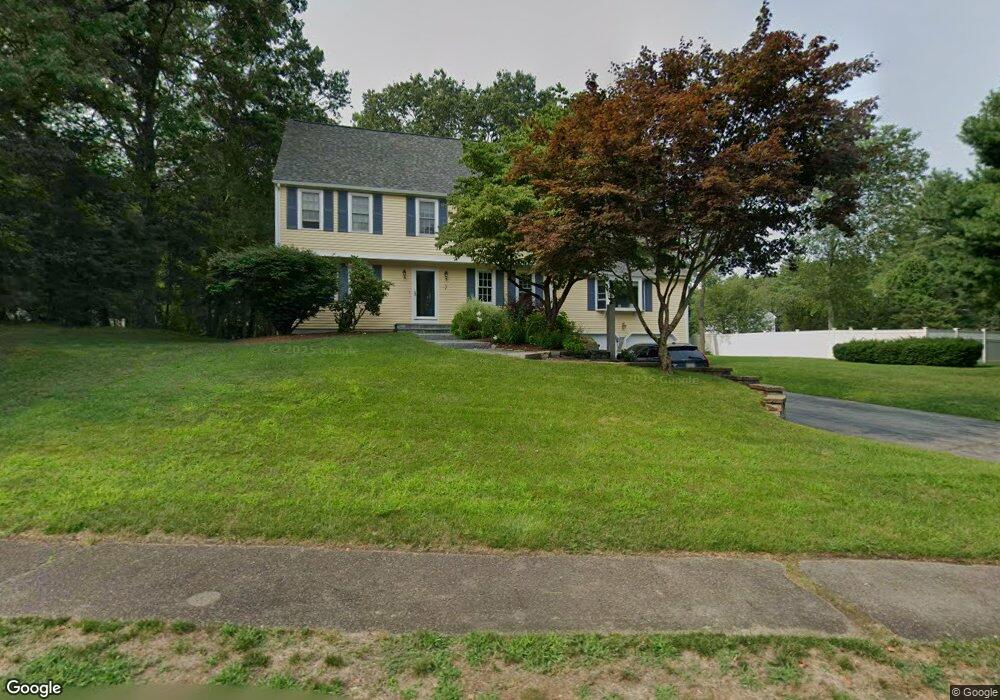
7 Westview Dr Mansfield, MA 02048
Estimated Value: $851,389 - $1,026,000
4
Beds
3
Baths
2,560
Sq Ft
$374/Sq Ft
Est. Value
About This Home
This home is located at 7 Westview Dr, Mansfield, MA 02048 and is currently estimated at $957,097, approximately $373 per square foot. 7 Westview Dr is a home located in Bristol County with nearby schools including Everett W. Robinson Elementary School, Jordan/Jackson Elementary School, and Harold L. Qualters Middle School.
Ownership History
Date
Name
Owned For
Owner Type
Purchase Details
Closed on
Apr 23, 2003
Sold by
Herbst Eric M and Herbst Susan M
Bought by
Farley Cheryl D and Farley Daniel P
Current Estimated Value
Home Financials for this Owner
Home Financials are based on the most recent Mortgage that was taken out on this home.
Original Mortgage
$380,000
Interest Rate
5.64%
Mortgage Type
Purchase Money Mortgage
Purchase Details
Closed on
Oct 29, 1999
Sold by
Kujala Rocco J and Taggart-Kujala Marilyn
Bought by
Herbst Eric M and Herbst Susan M
Home Financials for this Owner
Home Financials are based on the most recent Mortgage that was taken out on this home.
Original Mortgage
$240,000
Interest Rate
7.78%
Mortgage Type
Purchase Money Mortgage
Create a Home Valuation Report for This Property
The Home Valuation Report is an in-depth analysis detailing your home's value as well as a comparison with similar homes in the area
Home Values in the Area
Average Home Value in this Area
Purchase History
| Date | Buyer | Sale Price | Title Company |
|---|---|---|---|
| Farley Cheryl D | $475,000 | -- | |
| Herbst Eric M | $314,000 | -- |
Source: Public Records
Mortgage History
| Date | Status | Borrower | Loan Amount |
|---|---|---|---|
| Open | Herbst Eric M | $313,000 | |
| Closed | Farley Cheryl D | $380,000 | |
| Previous Owner | Herbst Eric M | $268,750 | |
| Previous Owner | Herbst Eric M | $240,000 | |
| Previous Owner | Herbst Eric M | $88,800 |
Source: Public Records
Tax History
| Year | Tax Paid | Tax Assessment Tax Assessment Total Assessment is a certain percentage of the fair market value that is determined by local assessors to be the total taxable value of land and additions on the property. | Land | Improvement |
|---|---|---|---|---|
| 2025 | $10,066 | $764,300 | $278,100 | $486,200 |
| 2024 | $9,990 | $740,000 | $290,200 | $449,800 |
| 2023 | $9,632 | $683,600 | $290,200 | $393,400 |
| 2022 | $9,002 | $593,400 | $268,600 | $324,800 |
| 2021 | $8,766 | $570,700 | $223,900 | $346,800 |
| 2020 | $8,626 | $561,600 | $223,900 | $337,700 |
| 2019 | $8,024 | $527,200 | $186,500 | $340,700 |
| 2018 | $7,981 | $512,600 | $177,900 | $334,700 |
| 2017 | $7,486 | $498,400 | $172,800 | $325,600 |
| 2016 | $6,763 | $438,900 | $164,500 | $274,400 |
| 2015 | $6,591 | $425,200 | $164,500 | $260,700 |
Source: Public Records
Map
Nearby Homes
- 24 Maverick Dr
- 25 Shepherd St
- 128 Tremont St
- 150 Gilbert St
- 17 Childs Ln
- 25 Munroe Dr
- 84 Messenger St
- 9 Coach Rd
- 14 Claire Ave
- 40 Treasure Island Rd
- 33 Colonial Way
- 1769 West St
- 16 Treasure Island Rd
- 401 South St
- 115 Westfield Dr
- 57 Vine St
- 28 Messenger St
- 46 Mirimichi St
- 38 Mirimichi St
- 49 Pheasant Hill Rd
Your Personal Tour Guide
Ask me questions while you tour the home.