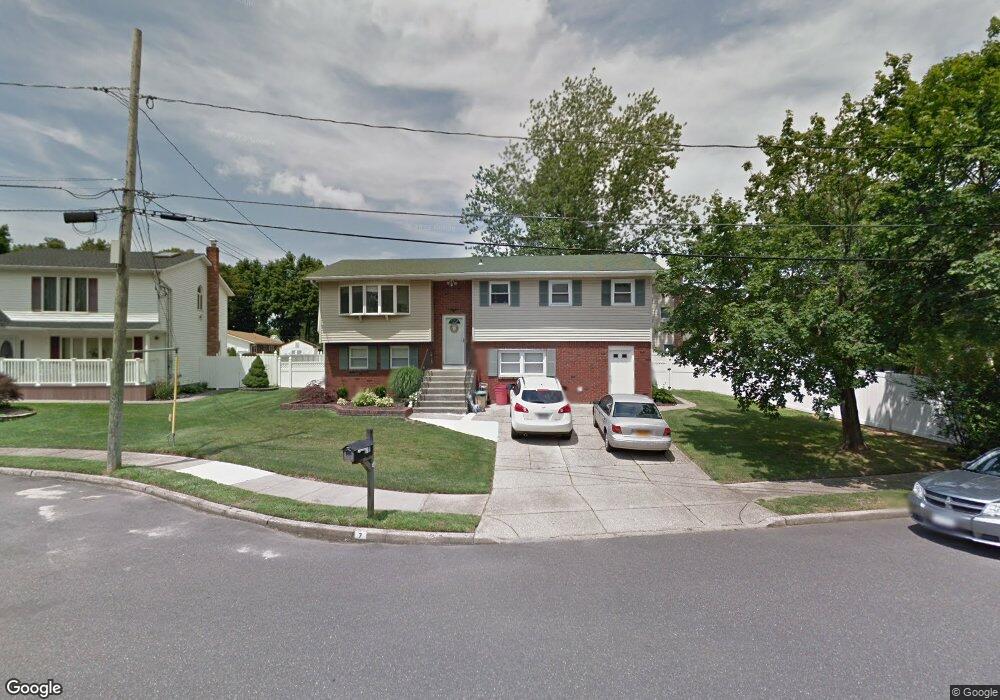
7 Whig Ct Holbrook, NY 11741
Estimated Value: $557,641 - $778,000
--
Bed
--
Bath
2,221
Sq Ft
$301/Sq Ft
Est. Value
About This Home
This home is located at 7 Whig Ct, Holbrook, NY 11741 and is currently estimated at $668,410, approximately $300 per square foot. 7 Whig Ct is a home located in Suffolk County with nearby schools including Seneca Middle School, Sachem High School North, and Long Island Baptist Academy.
Ownership History
Date
Name
Owned For
Owner Type
Purchase Details
Closed on
Mar 31, 2000
Sold by
Spatola Joann and Spatola Mildred
Bought by
Morena Frank and Morena Jill
Current Estimated Value
Home Financials for this Owner
Home Financials are based on the most recent Mortgage that was taken out on this home.
Original Mortgage
$190,950
Outstanding Balance
$67,862
Interest Rate
8.75%
Estimated Equity
$600,548
Purchase Details
Closed on
May 28, 1998
Sold by
Mirabella Scott
Bought by
Spatola Joann and Spatola Mildred
Create a Home Valuation Report for This Property
The Home Valuation Report is an in-depth analysis detailing your home's value as well as a comparison with similar homes in the area
Home Values in the Area
Average Home Value in this Area
Purchase History
| Date | Buyer | Sale Price | Title Company |
|---|---|---|---|
| Morena Frank | $185,500 | -- | |
| Spatola Joann | $137,000 | Fidelity National Title Ins |
Source: Public Records
Mortgage History
| Date | Status | Borrower | Loan Amount |
|---|---|---|---|
| Open | Morena Frank | $190,950 |
Source: Public Records
Tax History Compared to Growth
Tax History
| Year | Tax Paid | Tax Assessment Tax Assessment Total Assessment is a certain percentage of the fair market value that is determined by local assessors to be the total taxable value of land and additions on the property. | Land | Improvement |
|---|---|---|---|---|
| 2024 | -- | $41,000 | $9,500 | $31,500 |
| 2023 | -- | $41,000 | $9,500 | $31,500 |
| 2022 | $8,702 | $41,000 | $9,500 | $31,500 |
| 2021 | $8,702 | $41,000 | $9,500 | $31,500 |
| 2020 | $8,688 | $41,000 | $9,500 | $31,500 |
| 2019 | $8,702 | $41,000 | $9,500 | $31,500 |
| 2018 | -- | $41,000 | $9,500 | $31,500 |
| 2017 | $8,934 | $41,000 | $9,500 | $31,500 |
| 2016 | $8,540 | $41,000 | $9,500 | $31,500 |
| 2015 | -- | $41,000 | $9,500 | $31,500 |
| 2014 | -- | $41,000 | $9,500 | $31,500 |
Source: Public Records
Map
Nearby Homes