Estimated Value: $1,275,749 - $1,855,000
3
Beds
2
Baths
2,384
Sq Ft
$634/Sq Ft
Est. Value
About This Home
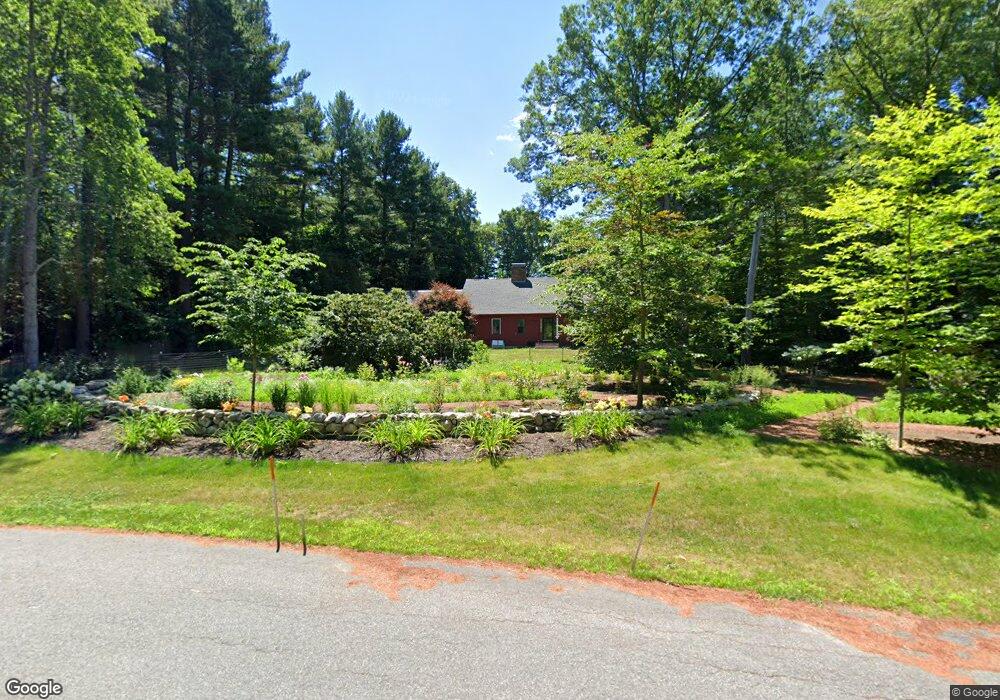
This home is located at 7 Wildwood Rd, Dover, MA 02030 and is currently estimated at $1,511,187, approximately $633 per square foot. 7 Wildwood Rd is a home located in Norfolk County with nearby schools including Chickering Elementary School, Dover-Sherborn Regional Middle School, and Dover-Sherborn Regional High School.
Ownership History
Date
Name
Owned For
Owner Type
Purchase Details
Closed on
Oct 31, 2006
Sold by
Thayer Bruce A and Thayer Susan P
Bought by
Pasch Kenneth A and Pasch Jeanne M
Current Estimated Value
Home Financials for this Owner
Home Financials are based on the most recent Mortgage that was taken out on this home.
Original Mortgage
$639,200
Interest Rate
6.48%
Mortgage Type
Purchase Money Mortgage
Purchase Details
Closed on
Nov 4, 1997
Sold by
Est Collins Audrey D and Collins Clare E
Bought by
Thayer Bruce A and Thayer Susan P
Home Financials for this Owner
Home Financials are based on the most recent Mortgage that was taken out on this home.
Original Mortgage
$209,500
Interest Rate
7.31%
Mortgage Type
Purchase Money Mortgage
Create a Home Valuation Report for This Property
The Home Valuation Report is an in-depth analysis detailing your home's value as well as a comparison with similar homes in the area
Home Values in the Area
Average Home Value in this Area
Purchase History
| Date | Buyer | Sale Price | Title Company |
|---|---|---|---|
| Pasch Kenneth A | $799,000 | -- | |
| Thayer Bruce A | $455,000 | -- |
Source: Public Records
Mortgage History
| Date | Status | Borrower | Loan Amount |
|---|---|---|---|
| Open | Thayer Bruce A | $618,780 | |
| Closed | Pasch Kenneth A | $639,200 | |
| Previous Owner | Thayer Bruce A | $209,500 | |
| Previous Owner | Thayer Bruce A | $200,000 |
Source: Public Records
Tax History Compared to Growth
Tax History
| Year | Tax Paid | Tax Assessment Tax Assessment Total Assessment is a certain percentage of the fair market value that is determined by local assessors to be the total taxable value of land and additions on the property. | Land | Improvement |
|---|---|---|---|---|
| 2025 | $11,577 | $1,027,200 | $725,200 | $302,000 |
| 2024 | $11,258 | $1,027,200 | $725,200 | $302,000 |
| 2023 | $10,910 | $895,000 | $633,300 | $261,700 |
| 2022 | $9,870 | $794,700 | $581,600 | $213,100 |
| 2021 | $10,244 | $794,700 | $581,600 | $213,100 |
| 2020 | $10,204 | $794,700 | $581,600 | $213,100 |
| 2019 | $10,275 | $794,700 | $581,600 | $213,100 |
| 2018 | $9,419 | $733,600 | $529,900 | $203,700 |
| 2017 | $9,573 | $733,600 | $529,900 | $203,700 |
| 2016 | $9,171 | $712,000 | $504,000 | $208,000 |
| 2015 | $9,042 | $712,000 | $504,000 | $208,000 |
Source: Public Records
Map
Nearby Homes