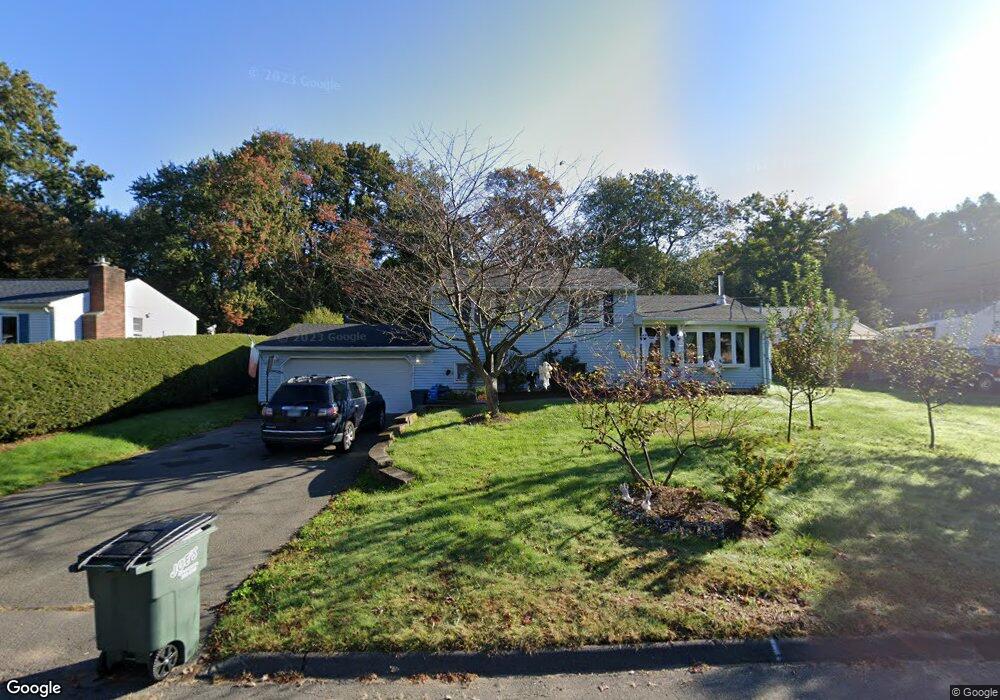
7 Wilkens Ln Prospect, CT 06712
Estimated Value: $335,000 - $399,492
3
Beds
6
Baths
1,440
Sq Ft
$258/Sq Ft
Est. Value
About This Home
This home is located at 7 Wilkens Ln, Prospect, CT 06712 and is currently estimated at $372,123, approximately $258 per square foot. 7 Wilkens Ln is a home located in New Haven County with nearby schools including Prospect Elementary School, Long River Middle School, and Woodland Regional High School.
Ownership History
Date
Name
Owned For
Owner Type
Purchase Details
Closed on
Nov 18, 2009
Sold by
Lorusso Nicole A
Bought by
Jackson Christopher M and Jackson Kellyann
Current Estimated Value
Home Financials for this Owner
Home Financials are based on the most recent Mortgage that was taken out on this home.
Original Mortgage
$216,015
Outstanding Balance
$140,036
Interest Rate
4.86%
Estimated Equity
$232,087
Purchase Details
Closed on
Apr 30, 1997
Sold by
Anyzeski Joseph J and Anyzeski Anna M
Bought by
Lorusso Nicole A and Lorusso Nicholas W
Create a Home Valuation Report for This Property
The Home Valuation Report is an in-depth analysis detailing your home's value as well as a comparison with similar homes in the area
Home Values in the Area
Average Home Value in this Area
Purchase History
| Date | Buyer | Sale Price | Title Company |
|---|---|---|---|
| Jackson Christopher M | $220,000 | -- | |
| Lorusso Nicole A | $132,000 | -- |
Source: Public Records
Mortgage History
| Date | Status | Borrower | Loan Amount |
|---|---|---|---|
| Open | Lorusso Nicole A | $62,643 | |
| Open | Lorusso Nicole A | $216,015 | |
| Previous Owner | Lorusso Nicole A | $78,000 |
Source: Public Records
Tax History
| Year | Tax Paid | Tax Assessment Tax Assessment Total Assessment is a certain percentage of the fair market value that is determined by local assessors to be the total taxable value of land and additions on the property. | Land | Improvement |
|---|---|---|---|---|
| 2025 | $5,334 | $208,600 | $59,640 | $148,960 |
| 2024 | $4,585 | $142,670 | $59,640 | $83,030 |
| 2023 | $4,554 | $142,670 | $59,640 | $83,030 |
| 2022 | $4,558 | $142,670 | $59,640 | $83,030 |
| 2021 | $4,608 | $142,670 | $59,640 | $83,030 |
| 2020 | $4,269 | $135,090 | $59,640 | $75,450 |
| 2019 | $4,181 | $135,090 | $59,640 | $75,450 |
| 2018 | $4,188 | $135,090 | $59,640 | $75,450 |
| 2017 | $4,222 | $135,090 | $59,640 | $75,450 |
| 2016 | $4,041 | $135,090 | $59,640 | $75,450 |
| 2015 | $3,904 | $133,570 | $59,640 | $73,930 |
| 2014 | $3,871 | $133,570 | $59,640 | $73,930 |
Source: Public Records
Map
Nearby Homes
Your Personal Tour Guide
Ask me questions while you tour the home.