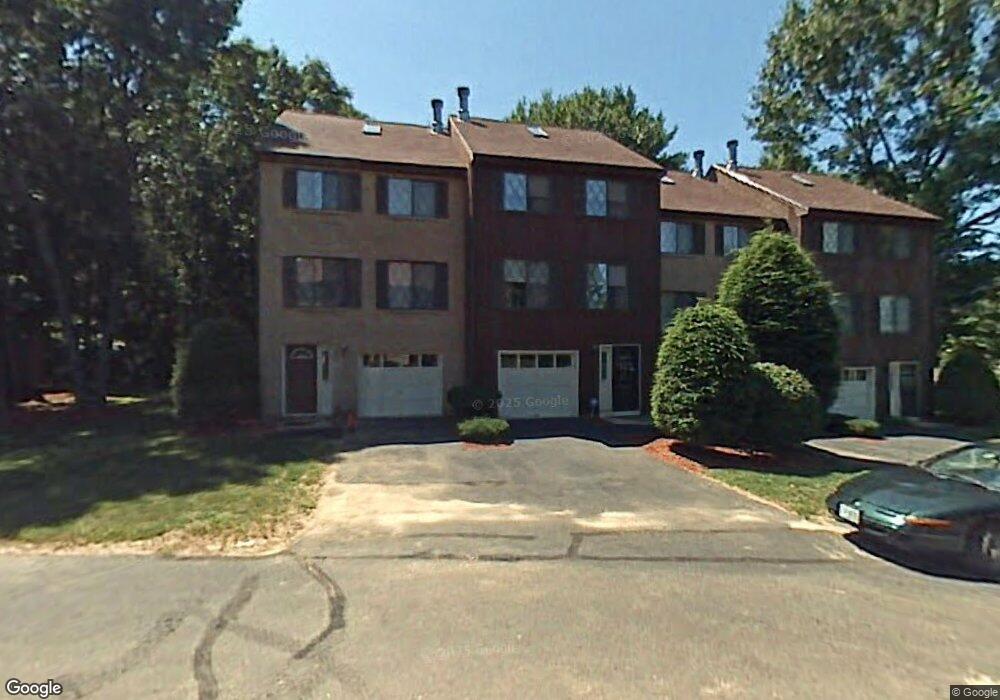
7 Winrow Dr Merrimack, NH 03054
Estimated Value: $352,673 - $391,000
2
Beds
2
Baths
1,725
Sq Ft
$215/Sq Ft
Est. Value
About This Home
This home is located at 7 Winrow Dr, Merrimack, NH 03054 and is currently estimated at $370,918, approximately $215 per square foot. 7 Winrow Dr is a home located in Hillsborough County with nearby schools including Thorntons Ferry School, Merrimack Middle School, and James Mastricola Upper Elementary School.
Ownership History
Date
Name
Owned For
Owner Type
Purchase Details
Closed on
Jan 5, 2022
Sold by
Ochal Sarah B
Bought by
Sarah B Ochal Ret and Ochal
Current Estimated Value
Purchase Details
Closed on
Aug 20, 2019
Sold by
Dorsey Robert D and Dorsey Ellen C
Bought by
Ochal Sarah
Home Financials for this Owner
Home Financials are based on the most recent Mortgage that was taken out on this home.
Original Mortgage
$174,600
Interest Rate
3.7%
Mortgage Type
New Conventional
Purchase Details
Closed on
Oct 10, 2001
Sold by
Four-M Invsts Llc
Bought by
Dorsey Robert D and Dorsey Ellen C
Home Financials for this Owner
Home Financials are based on the most recent Mortgage that was taken out on this home.
Original Mortgage
$120,000
Interest Rate
6.93%
Mortgage Type
Purchase Money Mortgage
Purchase Details
Closed on
Mar 1, 1999
Sold by
Hallock Christine
Bought by
4M Invests Llc
Create a Home Valuation Report for This Property
The Home Valuation Report is an in-depth analysis detailing your home's value as well as a comparison with similar homes in the area
Home Values in the Area
Average Home Value in this Area
Purchase History
| Date | Buyer | Sale Price | Title Company |
|---|---|---|---|
| Sarah B Ochal Ret | -- | None Available | |
| Ochal Sarah | $180,000 | -- | |
| Dorsey Robert D | $150,000 | -- | |
| 4M Invests Llc | $99,900 | -- |
Source: Public Records
Mortgage History
| Date | Status | Borrower | Loan Amount |
|---|---|---|---|
| Previous Owner | Ochal Sarah | $174,600 | |
| Previous Owner | 4M Invests Llc | $165,000 | |
| Previous Owner | 4M Invests Llc | $120,000 |
Source: Public Records
Tax History Compared to Growth
Tax History
| Year | Tax Paid | Tax Assessment Tax Assessment Total Assessment is a certain percentage of the fair market value that is determined by local assessors to be the total taxable value of land and additions on the property. | Land | Improvement |
|---|---|---|---|---|
| 2024 | $5,634 | $272,300 | $0 | $272,300 |
| 2023 | $5,119 | $263,200 | $0 | $263,200 |
| 2022 | $4,574 | $263,200 | $0 | $263,200 |
| 2021 | $4,519 | $263,200 | $0 | $263,200 |
| 2020 | $4,352 | $180,900 | $0 | $180,900 |
| 2019 | $4,365 | $180,900 | $0 | $180,900 |
| 2018 | $4,363 | $180,900 | $0 | $180,900 |
| 2017 | $4,228 | $180,900 | $0 | $180,900 |
| 2016 | $4,123 | $180,900 | $0 | $180,900 |
| 2015 | $4,282 | $173,200 | $0 | $173,200 |
| 2014 | $4,011 | $166,500 | $0 | $166,500 |
| 2013 | $3,981 | $166,500 | $0 | $166,500 |
Source: Public Records
Map
Nearby Homes
- 5 Lynn Dr
- 23 Colonial Dr
- 23 Pondview Dr
- 7 Hadley Rd
- 8 Highland Green Ln
- 27 Sarah Dr
- 5 Jennifer Dr Unit B
- 5 Jennifer Dr
- 5 Jennifer Dr Unit A
- 14 Turnbuckle Ln Unit 38
- 1 Longwood Ln
- 3 Independence Dr
- 40 Turkey Hill Rd
- 343 Charles Bancroft Hwy
- 14 Mayflower Dr
- 98 Indian Rock Rd
- 22 Clay St
- 5 Fernwood Dr
- 12 Clinton Ct
- 22 Essex Green Ct