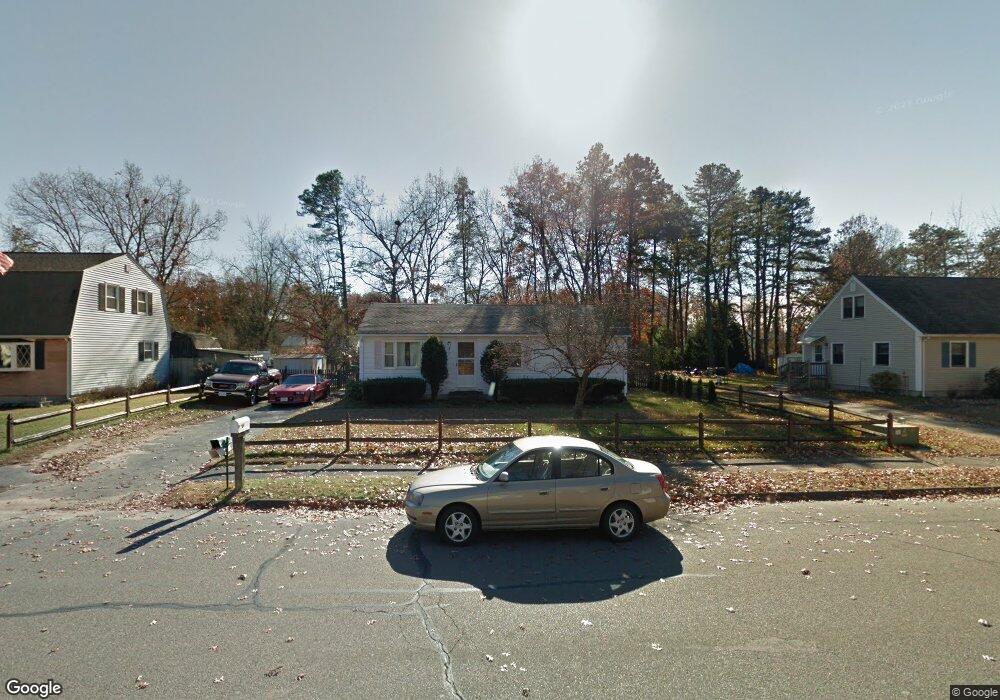
7 Zabek Dr Easthampton, MA 01027
Estimated Value: $312,988 - $345,000
3
Beds
2
Baths
960
Sq Ft
$345/Sq Ft
Est. Value
About This Home
This home is located at 7 Zabek Dr, Easthampton, MA 01027 and is currently estimated at $330,997, approximately $344 per square foot. 7 Zabek Dr is a home located in Hampshire County with nearby schools including Easthampton High School, Calvary Baptist Christian School, and Tri-County Schools.
Ownership History
Date
Name
Owned For
Owner Type
Purchase Details
Closed on
Sep 26, 2014
Sold by
Beresford Darlene G
Bought by
Beresford James A
Current Estimated Value
Purchase Details
Closed on
Sep 1, 1992
Sold by
Marek Richard W and Marek Linda L
Bought by
Beresford Darlene and Beresford James A
Home Financials for this Owner
Home Financials are based on the most recent Mortgage that was taken out on this home.
Original Mortgage
$104,319
Interest Rate
8.09%
Mortgage Type
Purchase Money Mortgage
Create a Home Valuation Report for This Property
The Home Valuation Report is an in-depth analysis detailing your home's value as well as a comparison with similar homes in the area
Home Values in the Area
Average Home Value in this Area
Purchase History
| Date | Buyer | Sale Price | Title Company |
|---|---|---|---|
| Beresford James A | -- | -- | |
| Beresford Darlene | $104,100 | -- |
Source: Public Records
Mortgage History
| Date | Status | Borrower | Loan Amount |
|---|---|---|---|
| Previous Owner | Beresford Darlene | $118,000 | |
| Previous Owner | Beresford Darlene | $21,000 | |
| Previous Owner | Beresford Darlene | $104,319 |
Source: Public Records
Tax History
| Year | Tax Paid | Tax Assessment Tax Assessment Total Assessment is a certain percentage of the fair market value that is determined by local assessors to be the total taxable value of land and additions on the property. | Land | Improvement |
|---|---|---|---|---|
| 2025 | $3,635 | $265,900 | $118,300 | $147,600 |
| 2024 | $3,507 | $258,600 | $114,900 | $143,700 |
| 2023 | $2,706 | $184,700 | $90,400 | $94,300 |
| 2022 | $3,053 | $184,700 | $90,400 | $94,300 |
| 2021 | $3,322 | $189,400 | $90,400 | $99,000 |
| 2020 | $3,280 | $184,700 | $90,400 | $94,300 |
| 2019 | $2,964 | $191,700 | $90,400 | $101,300 |
| 2018 | $2,846 | $177,900 | $85,400 | $92,500 |
| 2017 | $2,777 | $171,300 | $82,100 | $89,200 |
| 2016 | $2,753 | $176,600 | $82,100 | $94,500 |
| 2015 | $2,675 | $176,600 | $82,100 | $94,500 |
Source: Public Records
Map
Nearby Homes
Your Personal Tour Guide
Ask me questions while you tour the home.