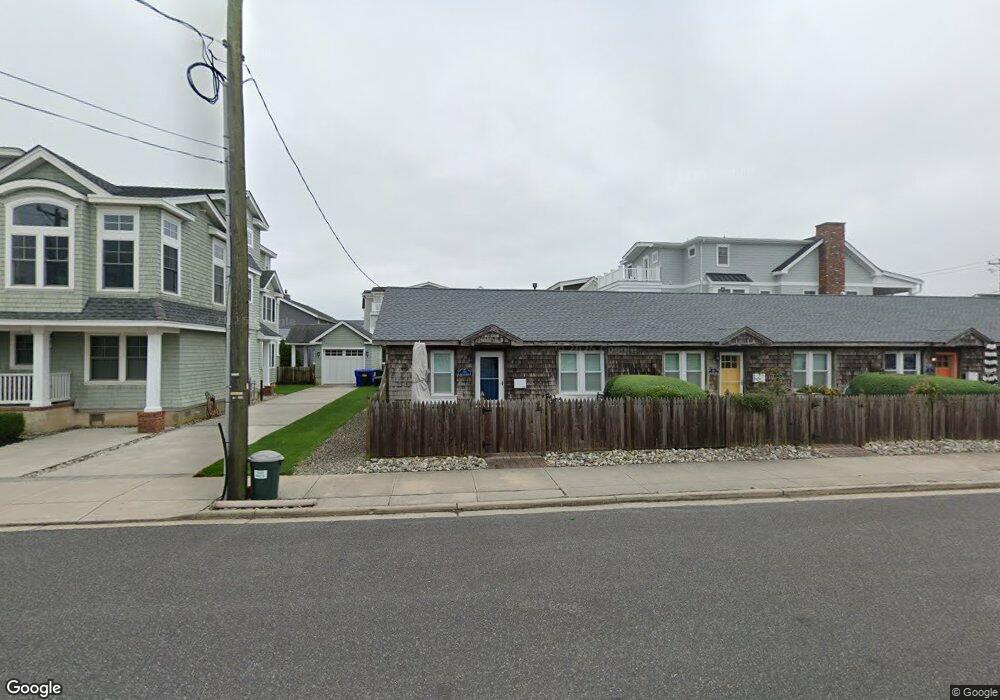
70 13th St W Avalon, NJ 08202
Estimated Value: $801,512 - $1,084,000
--
Bed
--
Bath
728
Sq Ft
$1,366/Sq Ft
Est. Value
About This Home
This home is located at 70 13th St W, Avalon, NJ 08202 and is currently estimated at $994,628, approximately $1,366 per square foot. 70 13th St W is a home located in Cape May County with nearby schools including Avalon Elementary School.
Ownership History
Date
Name
Owned For
Owner Type
Purchase Details
Closed on
May 15, 2016
Sold by
Shea Susan J
Bought by
Shea Susan J
Current Estimated Value
Purchase Details
Closed on
Sep 19, 2015
Sold by
Signorello Vincent J and Signorello Jutta M
Bought by
Shea Susan J
Home Financials for this Owner
Home Financials are based on the most recent Mortgage that was taken out on this home.
Original Mortgage
$337,500
Outstanding Balance
$130,701
Interest Rate
3.17%
Mortgage Type
New Conventional
Estimated Equity
$863,927
Purchase Details
Closed on
Feb 3, 2012
Sold by
Signorello Vincent J
Bought by
Signorello Vincent J and Signorello Jutta M
Purchase Details
Closed on
Oct 31, 2000
Sold by
Marsh David A
Bought by
Signorello Vincent J
Create a Home Valuation Report for This Property
The Home Valuation Report is an in-depth analysis detailing your home's value as well as a comparison with similar homes in the area
Home Values in the Area
Average Home Value in this Area
Purchase History
| Date | Buyer | Sale Price | Title Company |
|---|---|---|---|
| Shea Susan J | -- | Attorney | |
| Shea Susan J | $520,000 | Seaboard Title Agency | |
| Signorello Vincent J | -- | None Available | |
| Signorello Vincent J | $219,000 | -- |
Source: Public Records
Mortgage History
| Date | Status | Borrower | Loan Amount |
|---|---|---|---|
| Open | Shea Susan J | $337,500 |
Source: Public Records
Tax History Compared to Growth
Tax History
| Year | Tax Paid | Tax Assessment Tax Assessment Total Assessment is a certain percentage of the fair market value that is determined by local assessors to be the total taxable value of land and additions on the property. | Land | Improvement |
|---|---|---|---|---|
| 2025 | $3,084 | $502,300 | $425,000 | $77,300 |
| 2024 | $3,084 | $502,300 | $425,000 | $77,300 |
| 2023 | $3,059 | $502,300 | $425,000 | $77,300 |
| 2022 | $2,853 | $502,300 | $425,000 | $77,300 |
| 2021 | $2,748 | $502,300 | $425,000 | $77,300 |
| 2020 | $2,642 | $502,300 | $425,000 | $77,300 |
| 2019 | $2,562 | $502,300 | $425,000 | $77,300 |
| 2018 | $2,451 | $502,300 | $425,000 | $77,300 |
| 2017 | $2,905 | $522,500 | $425,000 | $97,500 |
| 2016 | $2,874 | $522,500 | $425,000 | $97,500 |
| 2015 | $2,827 | $522,500 | $425,000 | $97,500 |
| 2014 | $2,795 | $522,500 | $425,000 | $97,500 |
Source: Public Records
Map
Nearby Homes