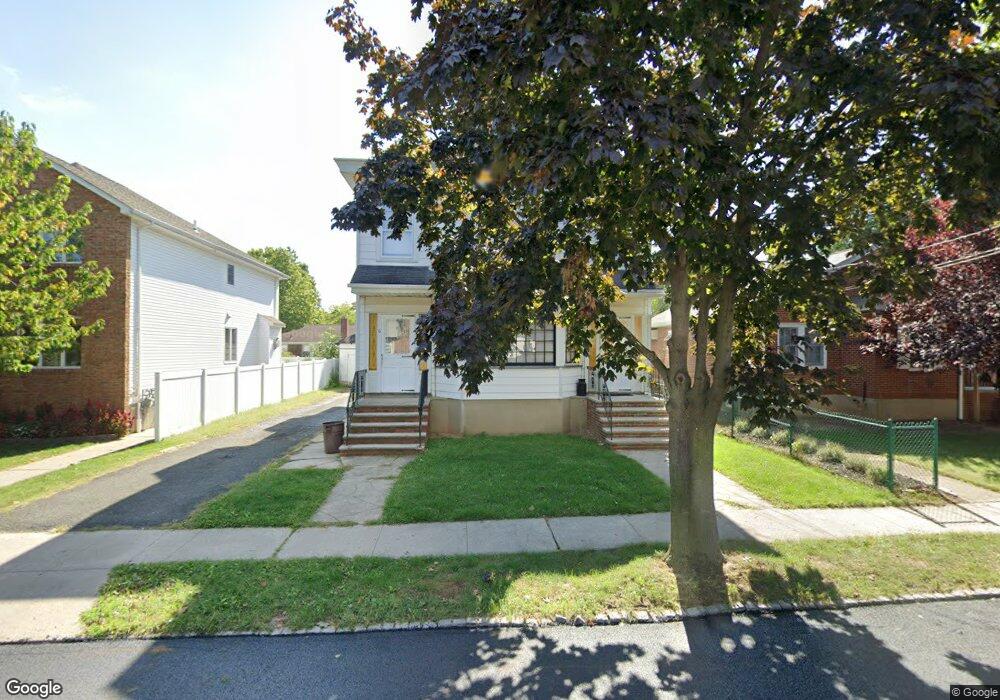
70 8 St Unit 2 Staten Island, NY 10306
New Dorp NeighborhoodEstimated Value: $912,580 - $1,227,000
3
Beds
2
Baths
1,500
Sq Ft
$706/Sq Ft
Est. Value
About This Home
This home is located at 70 8 St Unit 2, Staten Island, NY 10306 and is currently estimated at $1,058,895, approximately $705 per square foot. 70 8 St Unit 2 is a home located in Richmond County with nearby schools including P.S. 41 The Stephanie a Vierno School, Is 2 George L Egbert, and New Dorp High School.
Ownership History
Date
Name
Owned For
Owner Type
Purchase Details
Closed on
Mar 3, 2023
Sold by
Federal National Mortgage Association
Bought by
Kjoku Kjendrim and Kjoku Selami
Current Estimated Value
Home Financials for this Owner
Home Financials are based on the most recent Mortgage that was taken out on this home.
Original Mortgage
$70,000
Outstanding Balance
$67,787
Interest Rate
6.09%
Mortgage Type
New Conventional
Estimated Equity
$991,108
Purchase Details
Closed on
Feb 6, 2020
Sold by
Sparago Alex V and Estate Of Alex P Sparago
Bought by
Federal National Mortgage Association
Create a Home Valuation Report for This Property
The Home Valuation Report is an in-depth analysis detailing your home's value as well as a comparison with similar homes in the area
Home Values in the Area
Average Home Value in this Area
Purchase History
| Date | Buyer | Sale Price | Title Company |
|---|---|---|---|
| Kjoku Kjendrim | $890,000 | -- | |
| Federal National Mortgage Association | $686,384 | Ironman Abstract Llc |
Source: Public Records
Mortgage History
| Date | Status | Borrower | Loan Amount |
|---|---|---|---|
| Open | Kjoku Kjendrim | $70,000 |
Source: Public Records
Tax History Compared to Growth
Tax History
| Year | Tax Paid | Tax Assessment Tax Assessment Total Assessment is a certain percentage of the fair market value that is determined by local assessors to be the total taxable value of land and additions on the property. | Land | Improvement |
|---|---|---|---|---|
| 2025 | $10,347 | $56,400 | $10,779 | $45,621 |
| 2024 | $10,347 | $56,400 | $10,468 | $45,932 |
| 2023 | $9,870 | $48,600 | $8,675 | $39,925 |
| 2022 | $9,355 | $61,980 | $11,460 | $50,520 |
| 2021 | $9,304 | $51,300 | $11,460 | $39,840 |
| 2020 | $9,358 | $55,980 | $11,460 | $44,520 |
| 2019 | $10,560 | $56,940 | $11,460 | $45,480 |
| 2018 | $7,010 | $40,500 | $11,460 | $29,040 |
| 2017 | $6,962 | $39,050 | $11,250 | $27,800 |
| 2016 | $3,587 | $36,840 | $11,460 | $25,380 |
| 2015 | $3,460 | $39,269 | $8,819 | $30,450 |
| 2014 | $3,460 | $37,047 | $9,104 | $27,943 |
Source: Public Records
Map
Nearby Homes