70 Arona St Unit 80 Woonsocket, RI 02895
East Woonsocket NeighborhoodEstimated Value: $723,000 - $732,604
5
Beds
4
Baths
4,208
Sq Ft
$173/Sq Ft
Est. Value
About This Home
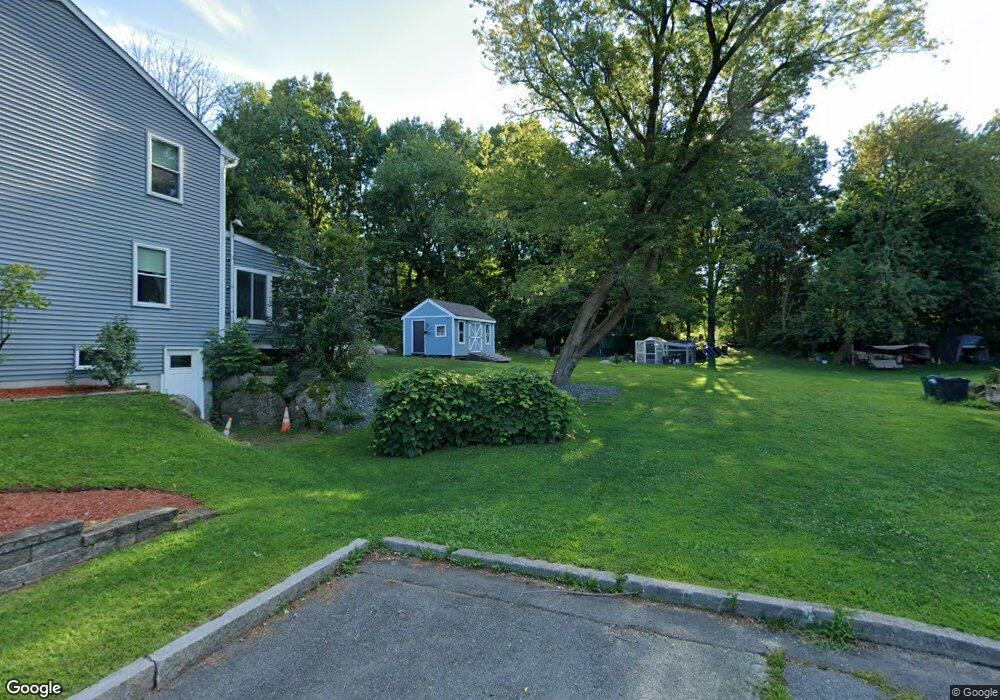
This home is located at 70 Arona St Unit 80, Woonsocket, RI 02895 and is currently estimated at $727,802, approximately $172 per square foot. 70 Arona St Unit 80 is a home located in Providence County with nearby schools including Woonsocket High School, Rise Prep Mayoral Academy Middle School, and Rise Prep Mayoral Academy.
Ownership History
Date
Name
Owned For
Owner Type
Purchase Details
Closed on
Feb 22, 2021
Sold by
Brin Rachel
Bought by
Rachel Brin T and Rachel Brin
Current Estimated Value
Purchase Details
Closed on
Dec 29, 2011
Sold by
Brin Kathleen and Brin Richard
Bought by
Brin Richard and Brin Rachel
Create a Home Valuation Report for This Property
The Home Valuation Report is an in-depth analysis detailing your home's value as well as a comparison with similar homes in the area
Home Values in the Area
Average Home Value in this Area
Purchase History
| Date | Buyer | Sale Price | Title Company |
|---|---|---|---|
| Rachel Brin T | -- | None Available | |
| Rachel Brin T | -- | None Available | |
| Rachel Brin T | -- | None Available | |
| Brin Richard | -- | -- | |
| Brin Richard | -- | -- |
Source: Public Records
Mortgage History
| Date | Status | Borrower | Loan Amount |
|---|---|---|---|
| Previous Owner | Brin Richard | $200,000 | |
| Previous Owner | Brin Richard | $63,000 | |
| Previous Owner | Brin Richard | $63,000 |
Source: Public Records
Tax History
| Year | Tax Paid | Tax Assessment Tax Assessment Total Assessment is a certain percentage of the fair market value that is determined by local assessors to be the total taxable value of land and additions on the property. | Land | Improvement |
|---|---|---|---|---|
| 2025 | $8,683 | $773,200 | $106,100 | $667,100 |
| 2024 | $7,516 | $516,900 | $86,600 | $430,300 |
| 2023 | $7,226 | $516,900 | $86,600 | $430,300 |
| 2022 | $7,226 | $516,900 | $86,600 | $430,300 |
| 2021 | $6,973 | $293,600 | $67,300 | $226,300 |
| 2020 | $7,046 | $293,600 | $67,300 | $226,300 |
| 2018 | $7,070 | $293,600 | $67,300 | $226,300 |
| 2017 | $9,635 | $320,100 | $64,300 | $255,800 |
| 2016 | $10,192 | $320,100 | $64,300 | $255,800 |
| 2015 | $11,709 | $320,100 | $64,300 | $255,800 |
| 2014 | $11,846 | $329,600 | $70,700 | $258,900 |
Source: Public Records
Map
Nearby Homes
- 95 Mitris Blvd
- 727 Mendon Rd
- 202 Paine St
- 194 Paine St
- 212 Saint Louis Ave
- 188 Saint Louis Ave
- 178 Saint Louis Ave
- 110 Saint Leon Ave
- 23 Rutland St
- 68 Kenwood St
- 82 Paine St
- 568 Elm St
- 34 Heroux Ave
- Lot 2 Pulaski Blvd
- 21 Irving St
- 375 Congress St
- 96 Mill St Unit 303
- 56 Mailloux St
- 311 Elm St
- 271 Elm St
Your Personal Tour Guide
Ask me questions while you tour the home.