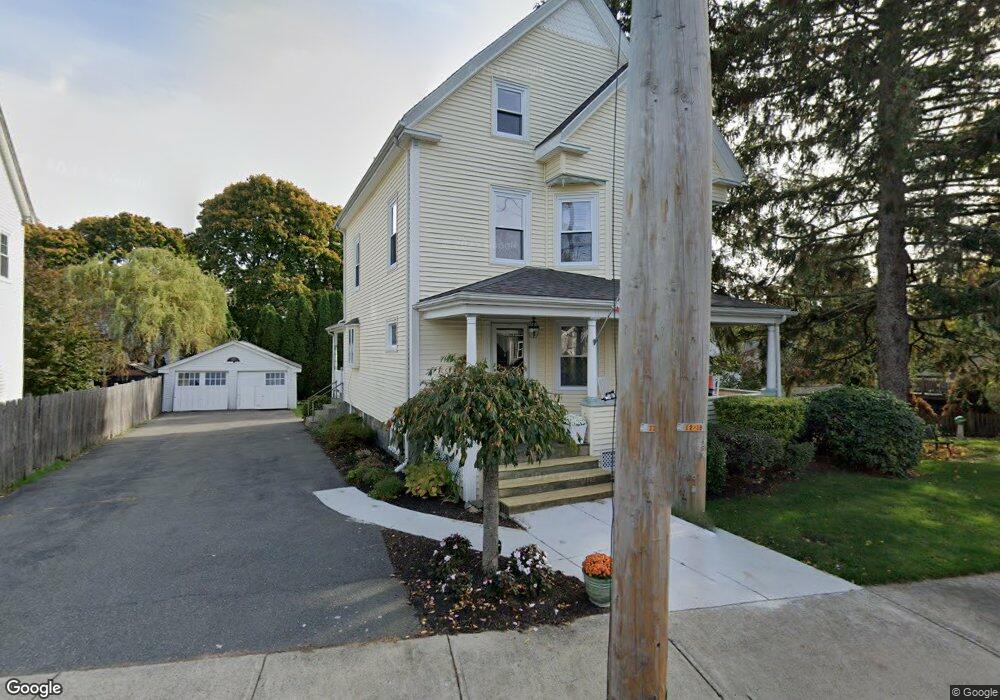
70 Bennett St Wakefield, MA 01880
East Side NeighborhoodEstimated Value: $815,000 - $962,943
6
Beds
3
Baths
2,590
Sq Ft
$341/Sq Ft
Est. Value
About This Home
This home is located at 70 Bennett St, Wakefield, MA 01880 and is currently estimated at $883,486, approximately $341 per square foot. 70 Bennett St is a home located in Middlesex County with nearby schools including Wakefield Memorial High School, St Joseph School, and Odyssey Day School.
Ownership History
Date
Name
Owned For
Owner Type
Purchase Details
Closed on
Apr 29, 1994
Sold by
Bartlett Marion L
Bought by
Obrien Mark W and Obrien Kimberly
Current Estimated Value
Create a Home Valuation Report for This Property
The Home Valuation Report is an in-depth analysis detailing your home's value as well as a comparison with similar homes in the area
Home Values in the Area
Average Home Value in this Area
Purchase History
| Date | Buyer | Sale Price | Title Company |
|---|---|---|---|
| Obrien Mark W | $175,000 | -- | |
| Obrien Mark W | $175,000 | -- |
Source: Public Records
Mortgage History
| Date | Status | Borrower | Loan Amount |
|---|---|---|---|
| Open | Obrien Mark W | $230,000 | |
| Closed | Obrien Mark W | $208,000 | |
| Closed | Obrien Mark W | $190,000 |
Source: Public Records
Tax History
| Year | Tax Paid | Tax Assessment Tax Assessment Total Assessment is a certain percentage of the fair market value that is determined by local assessors to be the total taxable value of land and additions on the property. | Land | Improvement |
|---|---|---|---|---|
| 2025 | $9,907 | $872,900 | $397,600 | $475,300 |
| 2024 | $9,764 | $867,900 | $395,300 | $472,600 |
| 2023 | $9,291 | $792,100 | $360,500 | $431,600 |
| 2022 | $8,896 | $722,100 | $328,400 | $393,700 |
| 2021 | $8,439 | $662,900 | $306,100 | $356,800 |
| 2020 | $7,914 | $619,700 | $286,100 | $333,600 |
| 2019 | $7,561 | $589,300 | $272,100 | $317,200 |
| 2018 | $7,041 | $543,700 | $251,000 | $292,700 |
| 2017 | $6,621 | $508,100 | $234,500 | $273,600 |
| 2016 | $6,197 | $459,400 | $221,900 | $237,500 |
| 2015 | $5,791 | $429,600 | $207,300 | $222,300 |
| 2014 | $5,282 | $413,300 | $199,400 | $213,900 |
Source: Public Records
Map
Nearby Homes
- 21 Herbert St Unit A
- 1 Traverse St Unit E
- 10 Wakefield Ave Unit B
- 61 Nahant St
- 34 Stark Ave
- 68 Preston St Unit 6D
- 43-45 Crescent St
- 0 Everett St
- 16 Pleasant St
- 1 Sidney St
- 62 Foundry St Unit 204
- 62 Foundry St Unit 402
- 62 Foundry St Unit 414
- 62 Foundry St Unit 210
- 69 Foundry St Unit 310
- 69 Foundry St Unit 416
- 177 Oak St
- 248 Albion St Unit 231
- 248 Albion St Unit 321
- 57 Wave Ave
- 39 Melvin St
- 39 Melvin St Unit 1
- 41 Melvin St Unit 2
- 41 Melvin St Unit 1
- 41 Melvin St Unit B
- 18 Herbert St
- 68 Bennett St
- 35 Melvin St Unit 37
- 35-37 Melvin St
- 20 Herbert St
- 67 Bennett St
- 43 Melvin St
- 43 Melvin St Unit A
- 10 Herbert St
- 5 Bateman Ct
- 5 Bateman Ct Unit 1-A
- 42 Melvin St
- 38 Melvin St
- 15 Herbert St
- 15 Herbert St Unit 2
Your Personal Tour Guide
Ask me questions while you tour the home.