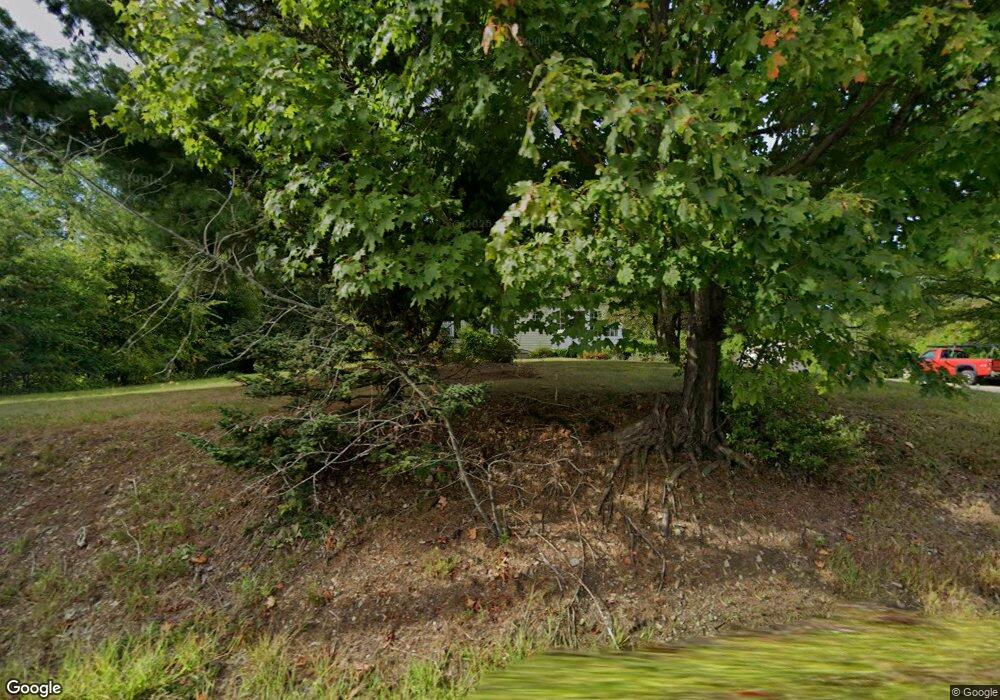
70 Broad St Hollis, NH 03049
Hollis NeighborhoodEstimated Value: $551,000 - $570,714
3
Beds
2
Baths
1,521
Sq Ft
$369/Sq Ft
Est. Value
About This Home
This home is located at 70 Broad St, Hollis, NH 03049 and is currently estimated at $561,429, approximately $369 per square foot. 70 Broad St is a home with nearby schools including Hollis Primary School, Hollis Upper Elementary School, and Hollis-Brookline Middle School.
Ownership History
Date
Name
Owned For
Owner Type
Purchase Details
Closed on
Aug 21, 2017
Sold by
Mullins Christine T
Bought by
Glover Christine T
Current Estimated Value
Home Financials for this Owner
Home Financials are based on the most recent Mortgage that was taken out on this home.
Original Mortgage
$190,000
Outstanding Balance
$101,616
Interest Rate
3.96%
Mortgage Type
New Conventional
Estimated Equity
$459,813
Purchase Details
Closed on
Jun 1, 1992
Bought by
Glover William D and Mullins Christine T
Create a Home Valuation Report for This Property
The Home Valuation Report is an in-depth analysis detailing your home's value as well as a comparison with similar homes in the area
Home Values in the Area
Average Home Value in this Area
Purchase History
| Date | Buyer | Sale Price | Title Company |
|---|---|---|---|
| Glover Christine T | -- | -- | |
| Glover William D | -- | -- |
Source: Public Records
Mortgage History
| Date | Status | Borrower | Loan Amount |
|---|---|---|---|
| Open | Glover Christine T | $190,000 |
Source: Public Records
Tax History Compared to Growth
Tax History
| Year | Tax Paid | Tax Assessment Tax Assessment Total Assessment is a certain percentage of the fair market value that is determined by local assessors to be the total taxable value of land and additions on the property. | Land | Improvement |
|---|---|---|---|---|
| 2024 | $8,005 | $451,500 | $241,800 | $209,700 |
| 2023 | $7,522 | $451,500 | $241,800 | $209,700 |
| 2022 | $10,190 | $451,500 | $241,800 | $209,700 |
| 2021 | $6,465 | $284,800 | $154,600 | $130,200 |
| 2020 | $6,602 | $284,800 | $154,600 | $130,200 |
| 2019 | $6,579 | $284,800 | $154,600 | $130,200 |
| 2018 | $5,130 | $284,800 | $154,600 | $130,200 |
| 2017 | $5,241 | $223,000 | $117,200 | $105,800 |
| 2016 | $5,225 | $223,000 | $117,200 | $105,800 |
| 2015 | $5,133 | $223,000 | $117,200 | $105,800 |
| 2014 | $5,026 | $217,300 | $111,500 | $105,800 |
| 2013 | $4,959 | $217,300 | $111,500 | $105,800 |
Source: Public Records
Map
Nearby Homes