
70 Carroll Ave Unit 708 Newport, RI 02840
Fifth Ward Neighborhood
2
Beds
1
Bath
708
Sq Ft
1962
Built
Highlights
- Furnished
- Cooling Available
- Shops
- Walking Distance to Water
- Bathtub with Shower
- Ceramic Tile Flooring
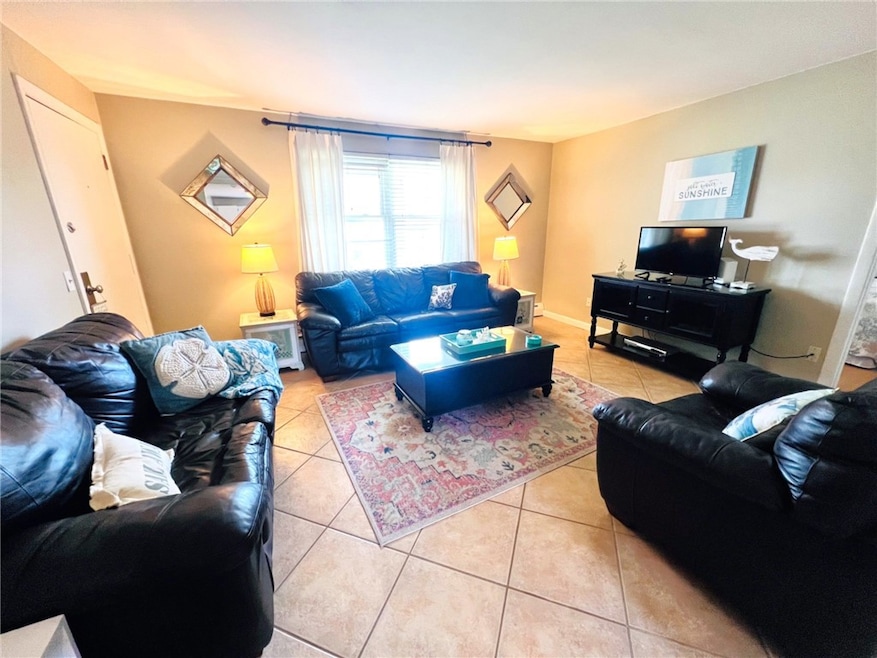
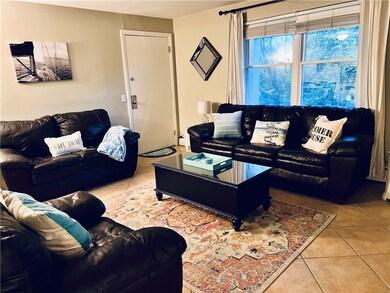
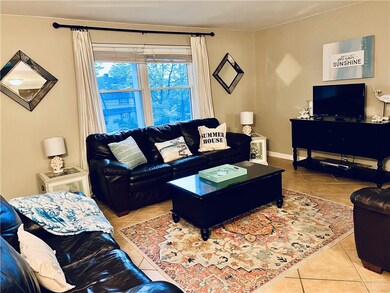
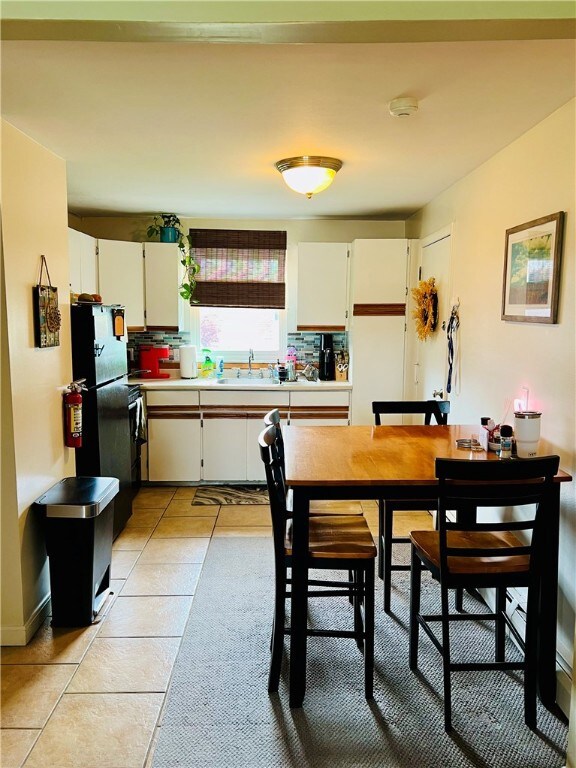
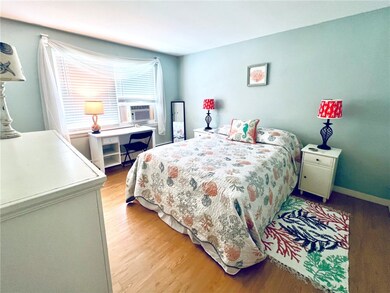
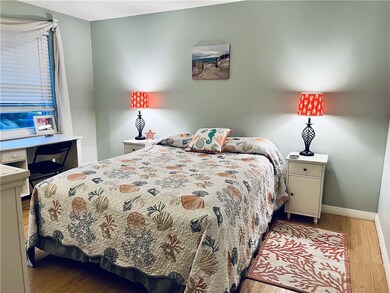
About This Home
Yearly furnished rental. June 1, 2026 -May 2027. Oceans Way Condo with 2 bedrooms and 1 bath. Enjoy this nicely furnished condo with a large living room with TV, and a eat-in kitchen with cookware and dishes. Parking and AC units available in each bedroom (queen beds). HEAT & WATER INCLUDED with rent. Laundry is available in the building. Terrific location with easy walking access to the waterfront restaurants, shops, parks. If you are attending war-college or one of the universities this would make an excellent share. Rent $2500/mo + electric + wifi. Good credit and references with application required. Sorry no pets allowed.
Listing Agent
Hogan Associates Christie's Brokerage Phone: 401-855-0485 License #RES.0028965 Listed on: 05/11/2025
Home Details
Home Type
- Single Family
Year Built
- Built in 1962
Home Design
- Entry on the 2nd floor
- Brick Exterior Construction
Interior Spaces
- 708 Sq Ft Home
- 1-Story Property
- Furnished
- Unfinished Basement
- Interior Basement Entry
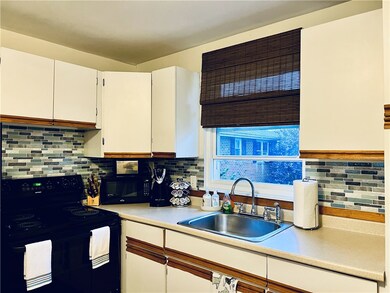
Kitchen
- Oven
- Range
- Microwave
Flooring
- Laminate
- Ceramic Tile
Bedrooms and Bathrooms
- 2 Bedrooms
- 1 Full Bathroom
- Bathtub with Shower
Parking
- 2 Parking Spaces
- No Garage
- Unassigned Parking
Utilities
- Cooling Available
- Heating System Uses Gas
- Baseboard Heating
Additional Features
- Walking Distance to Water
- Paved or Partially Paved Lot
Listing and Financial Details
- Property Available on 6/1/26
- 12 Month Lease Term
- Assessor Parcel Number 70CARROLLAV708NEWP
Community Details
Overview
- Property has a Home Owners Association
- Southern Thames St Subdivision
Amenities
- Shops
- Restaurant
Pet Policy
- No Pets Allowed
Map
Property History
| Date | Event | Price | List to Sale | Price per Sq Ft | Prior Sale |
|---|---|---|---|---|---|
| 09/18/2025 09/18/25 | Price Changed | $2,500 | +22.0% | $4 / Sq Ft | |
| 09/15/2025 09/15/25 | Rented | $2,050 | -14.6% | -- | |
| 08/02/2025 08/02/25 | Price Changed | $2,400 | +20.0% | $3 / Sq Ft | |
| 08/02/2025 08/02/25 | Price Changed | $2,000 | -50.0% | $3 / Sq Ft | |
| 06/06/2025 06/06/25 | Rented | $4,000 | +33.3% | -- | |
| 05/30/2025 05/30/25 | Price Changed | $3,000 | -14.3% | $4 / Sq Ft | |
| 05/23/2025 05/23/25 | Price Changed | $3,500 | +40.0% | $5 / Sq Ft | |
| 05/11/2025 05/11/25 | For Rent | $2,500 | +13.6% | -- | |
| 05/11/2025 05/11/25 | For Rent | $2,200 | -45.0% | -- | |
| 05/11/2025 05/11/25 | For Rent | $4,000 | +110.5% | -- | |
| 05/16/2023 05/16/23 | Rented | $1,900 | 0.0% | -- | |
| 05/02/2023 05/02/23 | Under Contract | -- | -- | -- | |
| 03/17/2023 03/17/23 | For Rent | $1,900 | +5.6% | -- | |
| 05/27/2022 05/27/22 | Rented | $1,800 | 0.0% | -- | |
| 05/11/2022 05/11/22 | Under Contract | -- | -- | -- | |
| 04/07/2022 04/07/22 | For Rent | $1,800 | -85.0% | -- | |
| 02/17/2022 02/17/22 | For Rent | $12,000 | +20.0% | -- | |
| 02/17/2022 02/17/22 | Rented | $10,000 | +525.0% | -- | |
| 08/01/2020 08/01/20 | Rented | $1,600 | 0.0% | -- | |
| 07/02/2020 07/02/20 | Under Contract | -- | -- | -- | |
| 06/18/2020 06/18/20 | For Rent | $1,600 | +3.2% | -- | |
| 11/01/2016 11/01/16 | Rented | $1,550 | 0.0% | -- | |
| 10/02/2016 10/02/16 | Under Contract | -- | -- | -- | |
| 08/03/2016 08/03/16 | For Rent | $1,550 | +29.2% | -- | |
| 10/17/2014 10/17/14 | For Rent | $1,200 | 0.0% | -- | |
| 10/17/2014 10/17/14 | Rented | $1,200 | 0.0% | -- | |
| 01/27/2014 01/27/14 | For Rent | $1,200 | 0.0% | -- | |
| 01/27/2014 01/27/14 | Rented | $1,200 | 0.0% | -- | |
| 06/13/2013 06/13/13 | Sold | $132,000 | -5.0% | $173 / Sq Ft | View Prior Sale |
| 05/14/2013 05/14/13 | Pending | -- | -- | -- | |
| 11/07/2012 11/07/12 | For Sale | $139,000 | -- | $182 / Sq Ft |
Source: State-Wide MLS
About the Listing Agent
Holly McLear was working in NYC when an invitation from an America’s Cup sailor lured her to Newport, RI. This Midwestern girl was instantly charmed by the City by the Sea and decided to make it her home purchasing an 1856 fixer upper on The Point, a quaint historic harbor neighborhood in downtown. Settling in this beautiful community with its scenic coastline, lively arts scene, historic architecture, and accessible educational institutions was easy for Holly who took to the Island and the
Holly's Other Listings
Source: State-Wide MLS
MLS Number: 1384731
APN: NEWP-000040-000003-000708
Disclaimer: Certain information contained herein is derived from information provided by parties other than Homes.com. All information provided is deemed reliable, but is not guaranteed to be accurate and should be independently verified.
![]() IDX information is provided exclusively for personal, non-commercial use, and may not be used for any purpose other than to identify prospective properties consumers may be interested in purchasing. Information is deemed reliable but not guaranteed.
IDX information is provided exclusively for personal, non-commercial use, and may not be used for any purpose other than to identify prospective properties consumers may be interested in purchasing. Information is deemed reliable but not guaranteed.
Copyright © 2026 State-Wide MLS, Inc. All rights reserved.
Nearby Homes
- 70 Carroll Ave Unit 510
- 6 Price's Cove Ave
- 73 Old Fort Rd Unit 75
- 39 Connection St
- 128 Ruggles Ave
- 6 Sullivan St
- 57 Clinton St Unit 57C
- 59 Houston Ave
- 46 Chastellux Ave Unit M6
- 32 Houston Ave
- 66 Webster St Unit 9
- 6 Sharon Ct
- 2 Harbor View Dr
- 421 Bellevue Ave Unit 3B
- 14 Lee Ave
- 401 Bellevue Ave Unit 112
- 11 Ocean Heights Rd
- 2 Perry St
- 111 Harrison Ave Unit A6
- 20 East St Unit 2A
- 70 Carroll Ave Unit 1210
- 70 Carroll Ave Unit 1009
- 70 Carroll Ave Unit 108
- 70 Carroll Ave Unit 303
- 70 Carroll Ave Unit 310
- 52 Old Fort Rd Unit 2S
- 27 Vaughan Ave Unit 2
- 27 Vaughan Ave
- 22 Carroll Ave
- 20 Carroll Ave
- 18 Palmer St
- 86 Carroll Ave
- 16 Carroll Ave
- 23 Shields St Unit 21
- 16 Vaughan Ave Unit 2
- 16 Vaughan Ave Unit 1
- 16 Vaughan Ave
- 23 Morgan St
- 34 Harrison Ave
- 7 Atlantic St
Your Personal Tour Guide
Ask me questions while you tour the home.