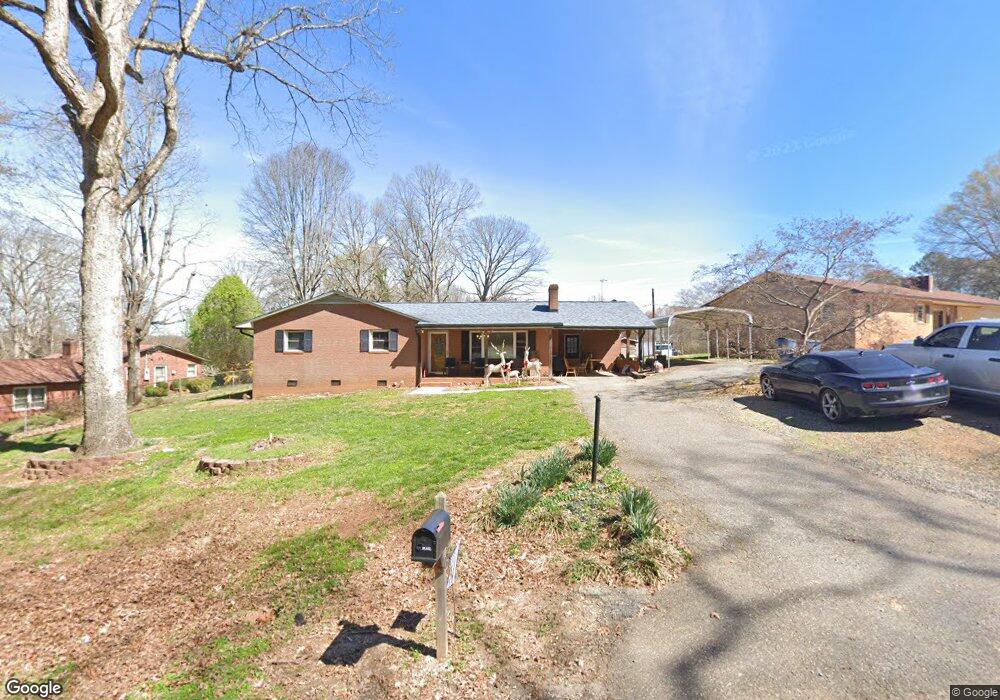
70 Circle Loop Stony Point, NC 28678
Stony Point NeighborhoodEstimated Value: $225,000 - $282,000
4
Beds
3
Baths
1,225
Sq Ft
$207/Sq Ft
Est. Value
About This Home
This home is located at 70 Circle Loop, Stony Point, NC 28678 and is currently estimated at $254,084, approximately $207 per square foot. 70 Circle Loop is a home with nearby schools including Stony Point Elementary School, East Alexander Middle School, and Alexander Central High School.
Ownership History
Date
Name
Owned For
Owner Type
Purchase Details
Closed on
Nov 16, 2020
Sold by
Stevenson Nicole Bost and Stevenson Zachary Aaron
Bought by
Stevenson Nicole Best and Stevenson Zachary Aaron
Current Estimated Value
Home Financials for this Owner
Home Financials are based on the most recent Mortgage that was taken out on this home.
Original Mortgage
$105,500
Outstanding Balance
$84,375
Interest Rate
2.8%
Mortgage Type
New Conventional
Estimated Equity
$169,709
Purchase Details
Closed on
Apr 21, 2020
Sold by
Scott Emily Jennings and Scott Ronald
Bought by
Stevenson Zachary and Stevenson Nicole Bost
Purchase Details
Closed on
Oct 12, 2015
Sold by
Mumford Hellard John Michael and Mumford Hellard Rebecca
Bought by
Bost Nicole Elizabeth
Home Financials for this Owner
Home Financials are based on the most recent Mortgage that was taken out on this home.
Original Mortgage
$110,204
Interest Rate
3.93%
Mortgage Type
New Conventional
Create a Home Valuation Report for This Property
The Home Valuation Report is an in-depth analysis detailing your home's value as well as a comparison with similar homes in the area
Home Values in the Area
Average Home Value in this Area
Purchase History
| Date | Buyer | Sale Price | Title Company |
|---|---|---|---|
| Stevenson Nicole Best | -- | None Available | |
| Bost Stevenson Nicole | -- | None Listed On Document | |
| Stevenson Zachary | $96,000 | None Available | |
| Bost Nicole Elizabeth | $108,000 | None Available |
Source: Public Records
Mortgage History
| Date | Status | Borrower | Loan Amount |
|---|---|---|---|
| Open | Bost Stevenson Nicole | $105,500 | |
| Previous Owner | Bost Nicole Elizabeth | $110,204 |
Source: Public Records
Tax History
| Year | Tax Paid | Tax Assessment Tax Assessment Total Assessment is a certain percentage of the fair market value that is determined by local assessors to be the total taxable value of land and additions on the property. | Land | Improvement |
|---|---|---|---|---|
| 2025 | $1,221 | $167,287 | $10,048 | $157,239 |
| 2024 | $1,238 | $167,287 | $10,048 | $157,239 |
| 2023 | $1,238 | $167,287 | $10,048 | $157,239 |
| 2022 | $851 | $98,941 | $9,135 | $89,806 |
| 2021 | $851 | $98,941 | $9,135 | $89,806 |
| 2020 | $851 | $98,941 | $9,135 | $89,806 |
| 2019 | $851 | $98,941 | $9,135 | $89,806 |
| 2018 | $841 | $98,941 | $9,135 | $89,806 |
| 2017 | $841 | $98,941 | $9,135 | $89,806 |
| 2016 | $841 | $98,941 | $9,135 | $89,806 |
| 2015 | $841 | $98,941 | $9,135 | $89,806 |
| 2014 | $841 | $111,910 | $12,915 | $98,995 |
| 2012 | -- | $111,910 | $12,915 | $98,995 |
Source: Public Records
Map
Nearby Homes
- 116 Barnes Ln
- 9 Walter St
- 7626 N Carolina 90
- 290 Mill Hill Ct
- 116 Lodge Hall Ct
- 100 Springs Ct
- 0 Old Mountain Rd Unit CAR4304814
- 44 Howard Norton Dr
- 1595 Cheatham Ford Rd
- 51 Rosemont Dr
- 657 Mount Wesley Church Rd
- 811 Sulphur Springs Rd
- 00 Davidson Ct
- 5336 Millersville Rd
- 156 Ridge Run Dr
- 1091 Midway Rd
- 45 Brentwood Dr
- 163 Forest Creek Dr
- 150 Forest Creek Dr
- 146 Forest Creek Dr
- 40 Circle Loop
- 100 Circle Loop
- 150 Circle Loop
- 28 Circle Loop
- 115 Circle Loop
- 65 Circle Loop
- 35 Circle Loop
- 51 Circle Loop
- 121 Circle Loop
- 259 Moose Dr
- 117 Circle Loop
- 275 Moose Dr
- 118 Moose Dr
- 35 Mickey Hager Mhp Dr
- 12 Kelly Dr
- 15 Kelly Dr
- 70 Moose Dr
- 81 Gabriel Ln
- 8117 Hwy 90 E
- 8117 Us Highway 64 90 W
Your Personal Tour Guide
Ask me questions while you tour the home.