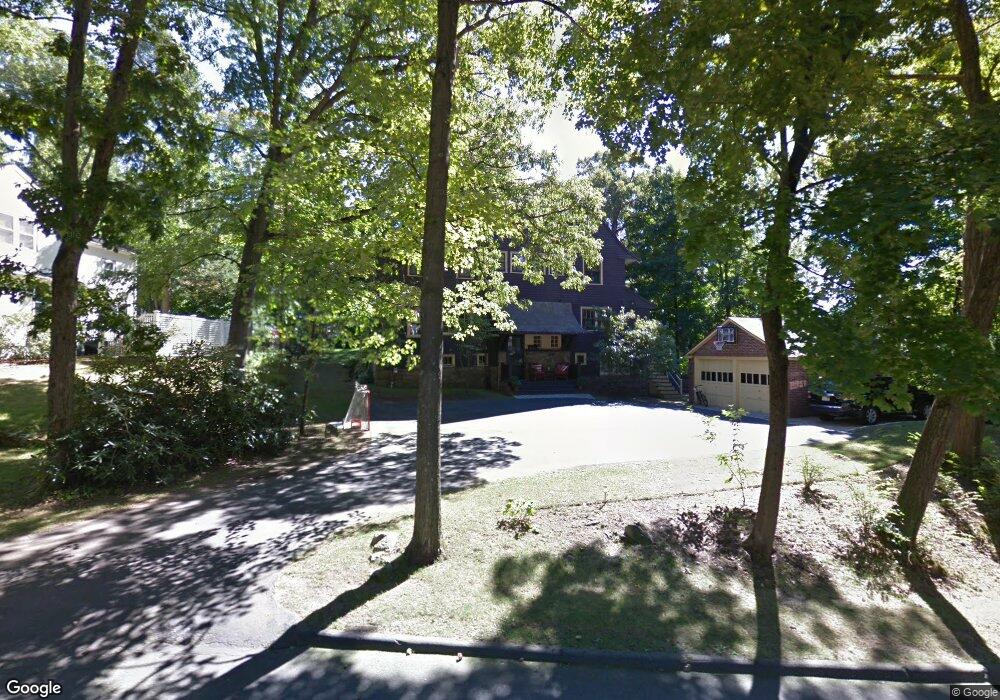
70 Curve St Wellesley, MA 02482
Wellesley Square NeighborhoodEstimated Value: $1,966,000 - $2,424,000
5
Beds
5
Baths
3,370
Sq Ft
$649/Sq Ft
Est. Value
About This Home
This home is located at 70 Curve St, Wellesley, MA 02482 and is currently estimated at $2,186,048, approximately $648 per square foot. 70 Curve St is a home located in Norfolk County with nearby schools including Sprague Elementary School, Wellesley Middle School, and Wellesley Sr High School.
Ownership History
Date
Name
Owned For
Owner Type
Purchase Details
Closed on
Jun 12, 2019
Sold by
Swenson James B
Bought by
Swenson Katherine W
Current Estimated Value
Purchase Details
Closed on
Sep 21, 2009
Sold by
70 Curve Street Rt
Bought by
Swenson Katherine W and Swenson James B
Home Financials for this Owner
Home Financials are based on the most recent Mortgage that was taken out on this home.
Original Mortgage
$395,000
Interest Rate
5.28%
Purchase Details
Closed on
Jun 22, 2007
Sold by
Nolan Jean C and Bradshaw Margaret A
Bought by
70 Curve Street Rt
Home Financials for this Owner
Home Financials are based on the most recent Mortgage that was taken out on this home.
Original Mortgage
$400,000
Interest Rate
6.14%
Mortgage Type
Purchase Money Mortgage
Create a Home Valuation Report for This Property
The Home Valuation Report is an in-depth analysis detailing your home's value as well as a comparison with similar homes in the area
Home Values in the Area
Average Home Value in this Area
Purchase History
| Date | Buyer | Sale Price | Title Company |
|---|---|---|---|
| Swenson Katherine W | -- | -- | |
| Swenson Katherine W | -- | -- | |
| 70 Curve Street Rt | $877,500 | -- |
Source: Public Records
Mortgage History
| Date | Status | Borrower | Loan Amount |
|---|---|---|---|
| Previous Owner | Swenson Katherine W | $395,000 | |
| Previous Owner | 70 Curve Street Rt | $400,000 |
Source: Public Records
Tax History Compared to Growth
Tax History
| Year | Tax Paid | Tax Assessment Tax Assessment Total Assessment is a certain percentage of the fair market value that is determined by local assessors to be the total taxable value of land and additions on the property. | Land | Improvement |
|---|---|---|---|---|
| 2025 | $19,409 | $1,888,000 | $1,042,000 | $846,000 |
| 2024 | $18,322 | $1,760,000 | $947,000 | $813,000 |
| 2023 | $18,022 | $1,574,000 | $839,000 | $735,000 |
| 2022 | $16,118 | $1,380,000 | $720,000 | $660,000 |
| 2021 | $15,851 | $1,349,000 | $689,000 | $660,000 |
| 2020 | $15,594 | $1,349,000 | $689,000 | $660,000 |
| 2019 | $13,791 | $1,192,000 | $658,000 | $534,000 |
| 2018 | $14,388 | $1,204,000 | $634,000 | $570,000 |
| 2017 | $13,700 | $1,162,000 | $634,000 | $528,000 |
| 2016 | $13,214 | $1,117,000 | $623,000 | $494,000 |
| 2015 | $12,554 | $1,086,000 | $593,000 | $493,000 |
Source: Public Records
Map
Nearby Homes
- 148 Weston Rd Unit 208
- 148 Weston Rd Unit 207
- 68 Linden St Unit 68
- 26B Pleasant St Unit B
- 63 Linden St Unit 1
- 100 Linden St Unit 111
- 100 Linden St Unit 103
- 100 Linden St Unit 303
- 100 Linden St Unit 105
- 16 Oak St
- 5 Abbott St
- 18 Patton Rd
- 11 Oak St Unit 62
- 16 Stearns Rd Unit 101
- 16 Stearns Rd Unit 302
- 16 Stearns Rd Unit 207
- 16 Stearns Rd Unit 301
- 16 Stearns Rd Unit 103
- 16 Stearns Rd Unit 202
- 16 Stearns Rd Unit 304