70 Cushman Rd Corinth, ME 04427
Estimated Value: $284,000 - $590,000
Studio
--
Bath
--
Sq Ft
348,480
Sq Ft Lot
About This Home
This home is located at 70 Cushman Rd, Corinth, ME 04427 and is currently estimated at $417,948. 70 Cushman Rd is a home with nearby schools including Central Community Elementary School and Central High School.
Ownership History
Date
Name
Owned For
Owner Type
Purchase Details
Closed on
Jul 25, 2024
Sold by
Sproul Charlene A
Bought by
Kabod Investments Llc
Current Estimated Value
Home Financials for this Owner
Home Financials are based on the most recent Mortgage that was taken out on this home.
Original Mortgage
$275,000
Outstanding Balance
$271,443
Interest Rate
6.95%
Mortgage Type
Commercial
Estimated Equity
$146,505
Create a Home Valuation Report for This Property
The Home Valuation Report is an in-depth analysis detailing your home's value as well as a comparison with similar homes in the area
Home Values in the Area
Average Home Value in this Area
Purchase History
| Date | Buyer | Sale Price | Title Company |
|---|---|---|---|
| Kabod Investments Llc | $450,000 | None Available | |
| Kabod Investments Llc | $450,000 | None Available |
Source: Public Records
Mortgage History
| Date | Status | Borrower | Loan Amount |
|---|---|---|---|
| Open | Kabod Investments Llc | $275,000 | |
| Closed | Kabod Investments Llc | $275,000 |
Source: Public Records
Tax History
| Year | Tax Paid | Tax Assessment Tax Assessment Total Assessment is a certain percentage of the fair market value that is determined by local assessors to be the total taxable value of land and additions on the property. | Land | Improvement |
|---|---|---|---|---|
| 2024 | $3,807 | $282,000 | $51,200 | $230,800 |
| 2023 | $3,685 | $276,000 | $49,700 | $226,300 |
| 2022 | $4,775 | $280,900 | $38,600 | $242,300 |
| 2021 | $4,775 | $280,900 | $38,600 | $242,300 |
| 2020 | $3,534 | $220,900 | $38,600 | $182,300 |
| 2019 | $3,345 | $213,050 | $36,390 | $176,660 |
| 2018 | $3,387 | $213,050 | $36,390 | $176,660 |
| 2017 | $3,409 | $213,050 | $36,390 | $176,660 |
| 2016 | $3,345 | $213,050 | $36,390 | $176,660 |
| 2015 | $3,132 | $213,050 | $36,390 | $176,660 |
| 2014 | $3,096 | $212,070 | $36,390 | $175,680 |
| 2013 | $2,948 | $212,070 | $36,390 | $175,680 |
Source: Public Records
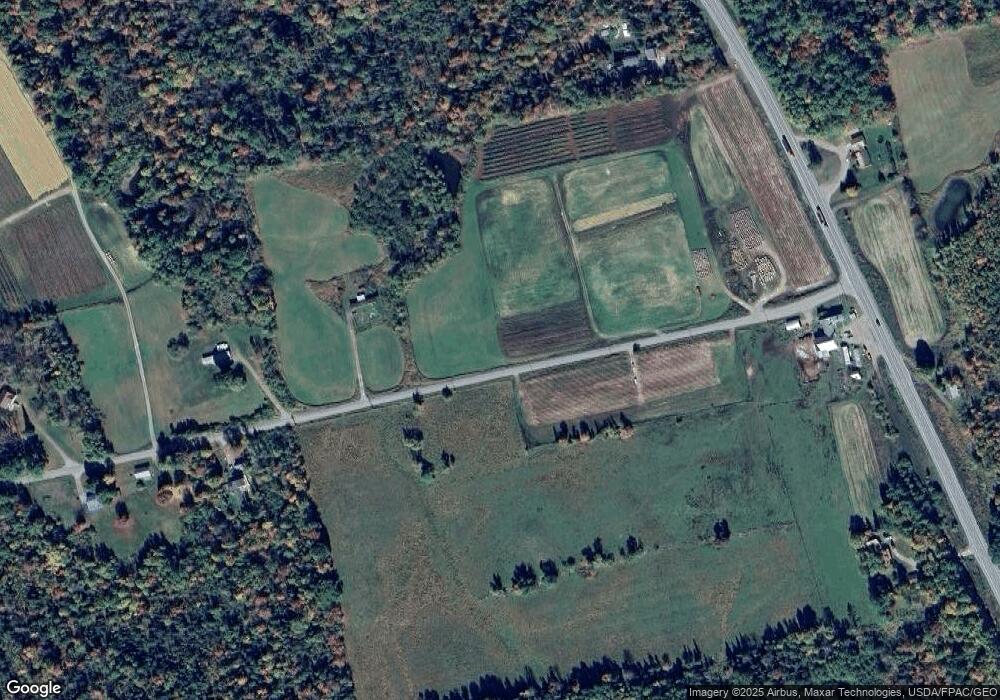
Map
Nearby Homes
- 748 Grant Rd
- 1156 Main St
- 465 Grant Rd
- 263 Mudgett Rd
- 40 Cookson
- Lot 24-07 Tate Rd
- 503 Stetson Rd
- 34 Center St
- 32 Center St
- 562 Ledge Hill Rd
- Lot 15-15 Brann Rd
- 467 Hudson Hill Rd
- 398 Hudson Hill Rd
- 98 White Schoolhouse Rd
- Lot 15-15 Stetson Rd E
- 67 Stacey Ln
- 189 Stetson Rd E
- 70 Clark Rd
- Lot #7 Kenduskeag Levant Rd
- 510 Kenduskeag Levant Rd
Your Personal Tour Guide
Ask me questions while you tour the home.