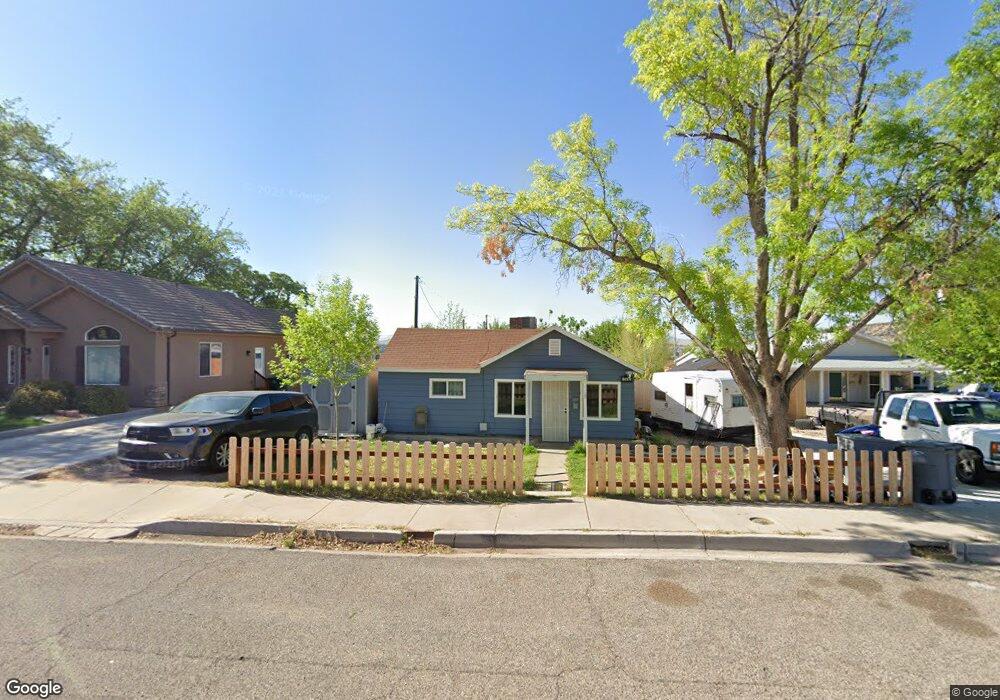
70 E 400 S Saint George, UT 84770
Estimated Value: $286,000 - $402,000
2
Beds
1
Bath
938
Sq Ft
$348/Sq Ft
Est. Value
About This Home
This home is located at 70 E 400 S, Saint George, UT 84770 and is currently estimated at $326,439, approximately $348 per square foot. 70 E 400 S is a home located in Washington County with nearby schools including Legacy School, Dixie Middle School, and Tonaquint Intermediate School.
Ownership History
Date
Name
Owned For
Owner Type
Purchase Details
Closed on
Aug 23, 2022
Sold by
Seegrist Alexander G
Bought by
City Of St George
Current Estimated Value
Purchase Details
Closed on
May 23, 2017
Sold by
Phillips Carl and Phillips Sherri F
Bought by
Seegrist Alexander G
Home Financials for this Owner
Home Financials are based on the most recent Mortgage that was taken out on this home.
Original Mortgage
$109,610
Interest Rate
3.97%
Mortgage Type
New Conventional
Purchase Details
Closed on
Dec 29, 2010
Sold by
Phillips Carl and Phillips Sherri F
Bought by
Phillips Carl and Phillips Sherri F
Purchase Details
Closed on
Apr 3, 2005
Sold by
Adams Samuel S
Bought by
Phillips Carl and Phillips Sherri F
Home Financials for this Owner
Home Financials are based on the most recent Mortgage that was taken out on this home.
Original Mortgage
$95,000
Interest Rate
6.75%
Mortgage Type
Adjustable Rate Mortgage/ARM
Create a Home Valuation Report for This Property
The Home Valuation Report is an in-depth analysis detailing your home's value as well as a comparison with similar homes in the area
Purchase History
| Date | Buyer | Sale Price | Title Company |
|---|---|---|---|
| City Of St George | -- | None Listed On Document | |
| Seegrist Alexander G | -- | Southern Utah Title | |
| Phillips Carl | -- | None Available | |
| Phillips Carl | -- | Southern Utah Title Co |
Source: Public Records
Mortgage History
| Date | Status | Borrower | Loan Amount |
|---|---|---|---|
| Previous Owner | Seegrist Alexander G | $109,610 | |
| Previous Owner | Phillips Carl | $95,000 |
Source: Public Records
Tax History
| Year | Tax Paid | Tax Assessment Tax Assessment Total Assessment is a certain percentage of the fair market value that is determined by local assessors to be the total taxable value of land and additions on the property. | Land | Improvement |
|---|---|---|---|---|
| 2025 | $1,731 | $274,300 | $130,000 | $144,300 |
| 2023 | $939 | $140,250 | $46,750 | $93,500 |
| 2022 | $999 | $140,305 | $46,750 | $93,555 |
| 2021 | $949 | $198,900 | $65,000 | $133,900 |
| 2020 | $919 | $181,300 | $60,000 | $121,300 |
| 2019 | $862 | $166,200 | $60,000 | $106,200 |
| 2016 | $741 | $66,220 | $0 | $0 |
Source: Public Records
Map
Nearby Homes
- 454 S 100 E Unit 10
- 433 S 100 E
- 453 S 100 E Unit 8
- 375 S Main St Unit 4
- 50 W 400 S Unit 6
- 55 W 400 S Unit 15
- 79 W 500 S
- 295 S 200 E
- 55 E 700 S Unit 8
- 544 S 100 W Unit 3
- 255 S 200 E Unit 13
- 376 E 300 S Unit 2
- 251 E 700 S
- 134 S 100 W Unit 6
- 377 S 300 W
- 379 S 300 W
- 96 S 200 E
- 660 S 400 E Unit 4
- 380 S 500 E
- 459 S 500 E
Your Personal Tour Guide
Ask me questions while you tour the home.