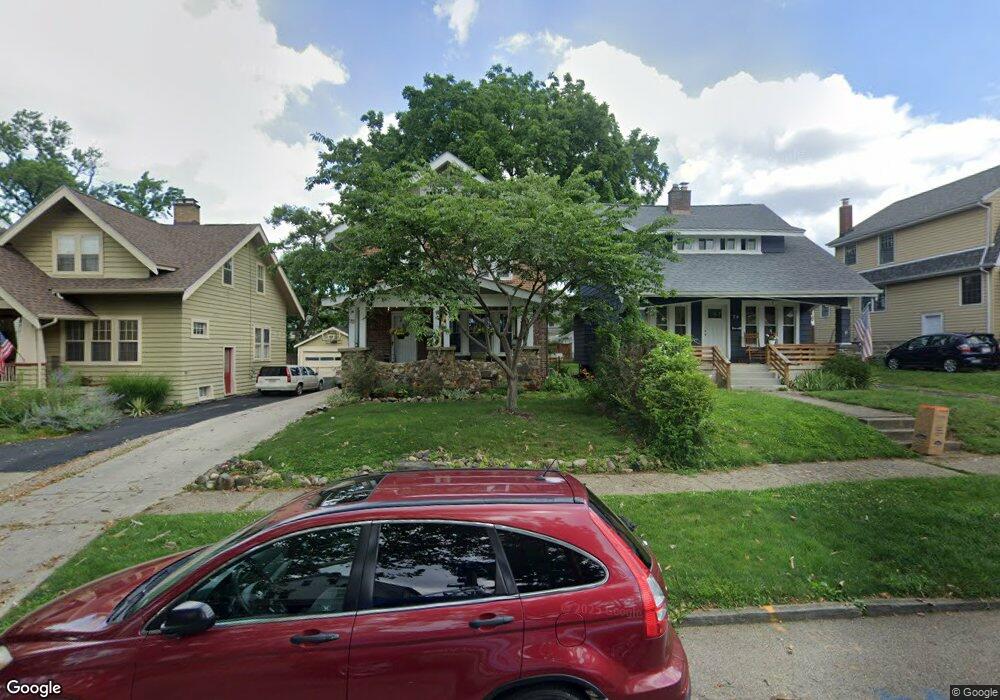
70 E Como Ave Columbus, OH 43202
Clintonville NeighborhoodEstimated Value: $474,272 - $509,000
3
Beds
2
Baths
1,964
Sq Ft
$251/Sq Ft
Est. Value
About This Home
This home is located at 70 E Como Ave, Columbus, OH 43202 and is currently estimated at $493,818, approximately $251 per square foot. 70 E Como Ave is a home located in Franklin County with nearby schools including Clinton Elementary School, Dominion Middle School, and Whetstone High School.
Ownership History
Date
Name
Owned For
Owner Type
Purchase Details
Closed on
May 29, 2014
Sold by
Hartung Alyson R
Bought by
Siegrist Jon and Hartung Alyson R
Current Estimated Value
Purchase Details
Closed on
Aug 22, 2008
Sold by
Balser David A and Balser Heather D
Bought by
Hartung Alyson R
Home Financials for this Owner
Home Financials are based on the most recent Mortgage that was taken out on this home.
Original Mortgage
$122,000
Outstanding Balance
$78,641
Interest Rate
6.31%
Mortgage Type
Purchase Money Mortgage
Estimated Equity
$415,177
Purchase Details
Closed on
Aug 5, 2005
Sold by
Balser David A and Balser Heather D
Bought by
Balser David A and Balser Heather D
Purchase Details
Closed on
Nov 15, 2002
Sold by
Abbott Paul S and Abbott Mary M
Bought by
Balser David A and Balser Heather D
Home Financials for this Owner
Home Financials are based on the most recent Mortgage that was taken out on this home.
Original Mortgage
$132,000
Interest Rate
6.22%
Mortgage Type
Purchase Money Mortgage
Purchase Details
Closed on
Jan 5, 1994
Purchase Details
Closed on
Jun 1, 1985
Create a Home Valuation Report for This Property
The Home Valuation Report is an in-depth analysis detailing your home's value as well as a comparison with similar homes in the area
Home Values in the Area
Average Home Value in this Area
Purchase History
| Date | Buyer | Sale Price | Title Company |
|---|---|---|---|
| Siegrist Jon | -- | None Available | |
| Hartung Alyson R | $207,000 | Service Tit | |
| Balser David A | -- | -- | |
| Balser David A | $165,000 | -- | |
| -- | $91,500 | -- | |
| -- | $55,000 | -- |
Source: Public Records
Mortgage History
| Date | Status | Borrower | Loan Amount |
|---|---|---|---|
| Open | Hartung Alyson R | $122,000 | |
| Previous Owner | Balser David A | $132,000 |
Source: Public Records
Tax History
| Year | Tax Paid | Tax Assessment Tax Assessment Total Assessment is a certain percentage of the fair market value that is determined by local assessors to be the total taxable value of land and additions on the property. | Land | Improvement |
|---|---|---|---|---|
| 2025 | $6,167 | $137,410 | $36,960 | $100,450 |
| 2024 | $6,167 | $137,410 | $36,960 | $100,450 |
| 2023 | $6,088 | $137,410 | $36,960 | $100,450 |
| 2022 | $6,346 | $122,360 | $27,300 | $95,060 |
| 2021 | $6,357 | $122,360 | $27,300 | $95,060 |
| 2020 | $6,366 | $122,360 | $27,300 | $95,060 |
| 2019 | $5,786 | $95,380 | $21,000 | $74,380 |
| 2018 | $5,057 | $95,380 | $21,000 | $74,380 |
| 2017 | $5,282 | $95,380 | $21,000 | $74,380 |
| 2016 | $4,781 | $72,170 | $17,500 | $54,670 |
| 2015 | $4,340 | $72,170 | $17,500 | $54,670 |
| 2014 | $4,350 | $72,170 | $17,500 | $54,670 |
| 2013 | $2,121 | $71,330 | $16,660 | $54,670 |
Source: Public Records
Map
Nearby Homes
- 83 Clinton Heights Ave
- 44 W Pacemont Rd
- 99 E Pacemont Rd
- 84-86 W Como Ave
- 45 E California Ave
- 123 W Como Ave
- 10 E Weber Rd Unit 402
- 270 Clinton Heights Ave
- 3021 N High St
- 94 W Tulane Rd
- 27 E Dunedin Rd
- 296 Walhalla Rd
- 116 E Dunedin Rd
- 231 W Pacemont Rd Unit 235
- 29 Crestview Rd
- 3052 Dorris Ave Unit 3052
- 30 E Torrence Rd
- 367 E Dunedin Rd
- 222 W North Broadway St
- 263 W North Broadway St
- 64 E Como Ave
- 74 E Como Ave
- 78 E Como Ave
- 54 E Como Ave
- 84 E Como Ave
- 77 E Longview Ave
- 83 E Longview Ave
- 67 E Longview Ave
- 87 E Longview Ave
- 48 E Como Ave
- 90 E Como Ave
- 63 E Como Ave Unit 65
- 63 E Longview Ave
- 93 E Longview Ave
- 77 E Como Ave Unit 79
- 57 W Como Ave
- 59 E Longview Ave
- 42 E Como Ave
- 49 E Como Ave
- 97 E Longview Ave
Your Personal Tour Guide
Ask me questions while you tour the home.