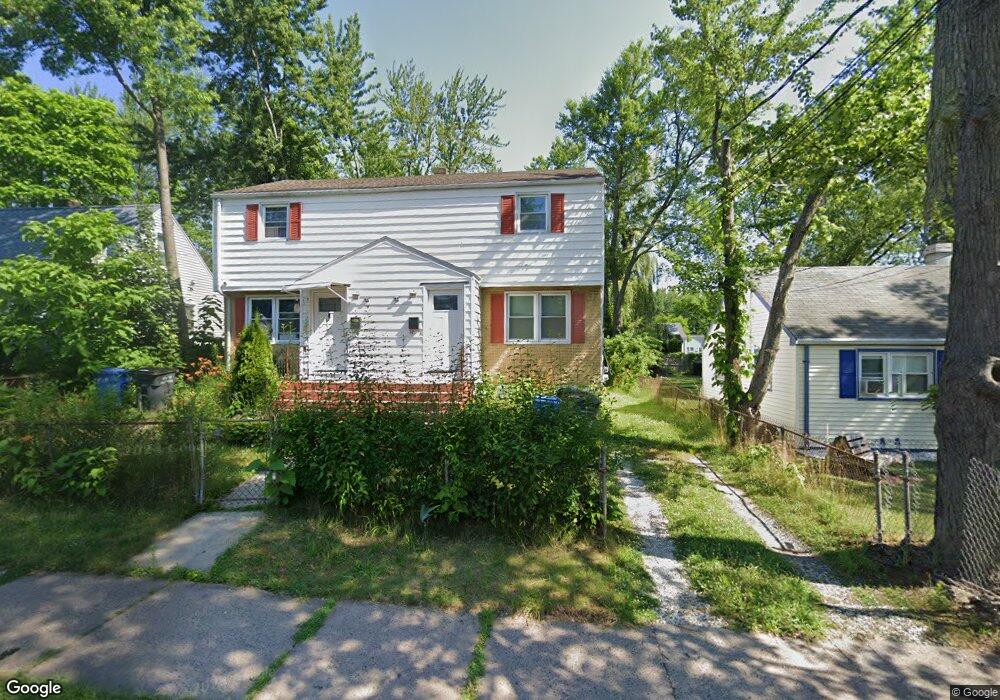
70 E Euclid St Unit 72 Hartford, CT 06112
Blue Hills NeighborhoodEstimated Value: $225,000 - $334,000
4
Beds
3
Baths
1,715
Sq Ft
$173/Sq Ft
Est. Value
About This Home
This home is located at 70 E Euclid St Unit 72, Hartford, CT 06112 and is currently estimated at $296,937, approximately $173 per square foot. 70 E Euclid St Unit 72 is a home located in Hartford County with nearby schools including Rawson School, Noah Webster Micro Society School, and McKinley School.
Ownership History
Date
Name
Owned For
Owner Type
Purchase Details
Closed on
Apr 10, 2006
Sold by
Brown Nola
Bought by
Sagay Lucky and Sagay Marcia
Current Estimated Value
Home Financials for this Owner
Home Financials are based on the most recent Mortgage that was taken out on this home.
Original Mortgage
$135,850
Outstanding Balance
$77,184
Interest Rate
6.26%
Mortgage Type
Purchase Money Mortgage
Estimated Equity
$219,753
Purchase Details
Closed on
Dec 6, 2001
Sold by
White Caleb and White Lillian
Bought by
Brown Nola
Home Financials for this Owner
Home Financials are based on the most recent Mortgage that was taken out on this home.
Original Mortgage
$114,900
Interest Rate
6.67%
Mortgage Type
Purchase Money Mortgage
Purchase Details
Closed on
Mar 3, 1989
Sold by
Minnis Helen B
Bought by
White Caleb T
Home Financials for this Owner
Home Financials are based on the most recent Mortgage that was taken out on this home.
Original Mortgage
$125,000
Interest Rate
10.63%
Mortgage Type
Purchase Money Mortgage
Create a Home Valuation Report for This Property
The Home Valuation Report is an in-depth analysis detailing your home's value as well as a comparison with similar homes in the area
Home Values in the Area
Average Home Value in this Area
Purchase History
| Date | Buyer | Sale Price | Title Company |
|---|---|---|---|
| Sagay Lucky | $143,000 | -- | |
| Brown Nola | $116,000 | -- | |
| White Caleb T | $145,000 | -- |
Source: Public Records
Mortgage History
| Date | Status | Borrower | Loan Amount |
|---|---|---|---|
| Open | White Caleb T | $135,850 | |
| Previous Owner | White Caleb T | $114,900 | |
| Previous Owner | White Caleb T | $7,400 | |
| Previous Owner | White Caleb T | $125,000 |
Source: Public Records
Tax History Compared to Growth
Tax History
| Year | Tax Paid | Tax Assessment Tax Assessment Total Assessment is a certain percentage of the fair market value that is determined by local assessors to be the total taxable value of land and additions on the property. | Land | Improvement |
|---|---|---|---|---|
| 2025 | $4,280 | $62,071 | $4,925 | $57,146 |
| 2024 | $4,280 | $62,071 | $4,925 | $57,146 |
| 2023 | $4,280 | $62,071 | $4,925 | $57,146 |
| 2022 | $4,280 | $62,071 | $4,925 | $57,146 |
| 2021 | $3,476 | $46,795 | $5,845 | $40,950 |
| 2020 | $3,476 | $46,795 | $5,845 | $40,950 |
| 2019 | $3,476 | $46,795 | $5,845 | $40,950 |
| 2018 | $3,359 | $45,217 | $5,648 | $39,569 |
| 2016 | $3,496 | $47,059 | $5,379 | $41,680 |
| 2015 | $3,330 | $44,823 | $5,123 | $39,700 |
| 2014 | $3,249 | $43,728 | $4,999 | $38,729 |
Source: Public Records
Map
Nearby Homes
- 97 E Burnham St
- 125 Lebanon St Unit 127
- 97 Boothbay St
- 30 Harding Ave
- 13 Patton Rd
- 117 E Harold St
- 67 Elizabeth Ave
- 36 Baltic St Unit 38
- 11 Pershing St Unit 13
- 10 Baltic St Unit 12
- 70 Burnham St Unit 72
- 175 E Pershing St
- 77 Harold St
- 86 Hartland St
- 147 Morningside St W
- 90 Manchester St
- 355 Cornwall St Unit 357
- 180 Brookline Ave
- 171 N Canaan St
- 179 Manchester St
- 68 E Euclid St
- 76 E Euclid St
- 64 E Euclid St
- 67 E Euclid St
- 75 E Euclid St
- 80 E Euclid St
- 60 E Euclid St
- 63 E Euclid St
- 79 E Euclid St
- 67 E Morningside St
- 59 E Euclid St
- 84 E Euclid St
- 56 E Euclid St
- 83 E Euclid St
- 71 E Morningside St
- 75 E Morningside St
- 55 E Euclid St
- 63 E Morningside St
- 52 E Euclid St
- 79 E Morningside St