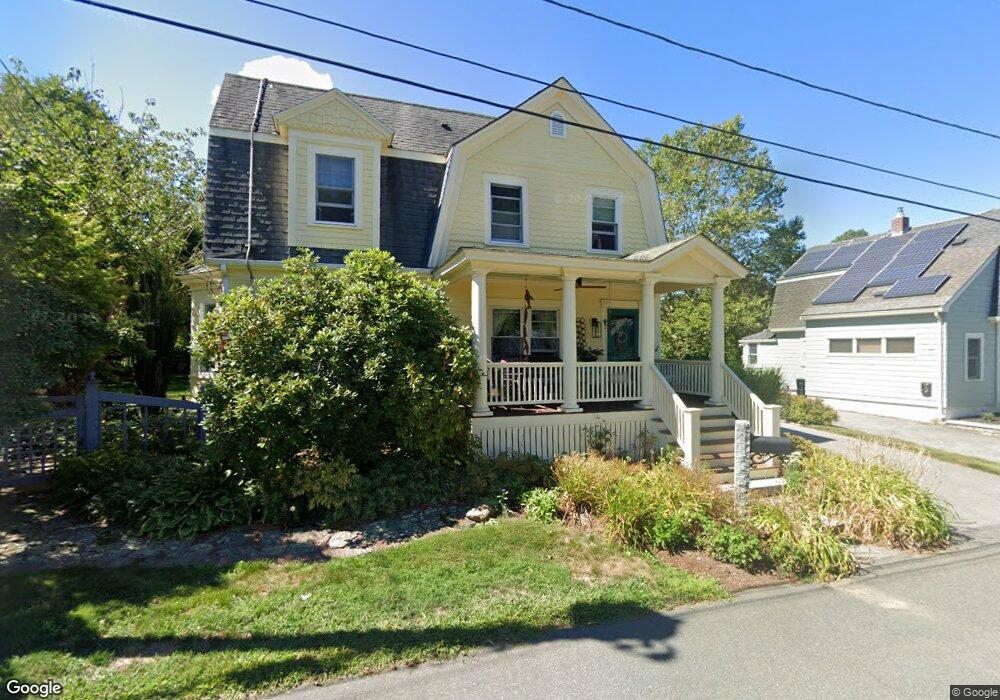
70 Hamilton Ave South Hamilton, MA 01982
Estimated Value: $708,000 - $804,000
3
Beds
2
Baths
1,583
Sq Ft
$472/Sq Ft
Est. Value
About This Home
This home is located at 70 Hamilton Ave, South Hamilton, MA 01982 and is currently estimated at $747,593, approximately $472 per square foot. 70 Hamilton Ave is a home located in Essex County with nearby schools including Winthrop School, Cutler Elementary School, and Bessie Buker Elementary School.
Ownership History
Date
Name
Owned For
Owner Type
Purchase Details
Closed on
Aug 8, 2023
Sold by
Crabb Gary S and Taylor-Crabb Joan R
Bought by
Crabb Ft and Crabb
Current Estimated Value
Purchase Details
Closed on
Apr 26, 1994
Sold by
Koloski A John A and Koloski Paul
Bought by
Crabb Gary S and Crabb Joan
Home Financials for this Owner
Home Financials are based on the most recent Mortgage that was taken out on this home.
Original Mortgage
$98,400
Interest Rate
7.6%
Mortgage Type
Purchase Money Mortgage
Create a Home Valuation Report for This Property
The Home Valuation Report is an in-depth analysis detailing your home's value as well as a comparison with similar homes in the area
Home Values in the Area
Average Home Value in this Area
Purchase History
| Date | Buyer | Sale Price | Title Company |
|---|---|---|---|
| Crabb Ft | -- | None Available | |
| Crabb Gary S | $123,000 | -- |
Source: Public Records
Mortgage History
| Date | Status | Borrower | Loan Amount |
|---|---|---|---|
| Previous Owner | Crabb Gary S | $88,988 | |
| Previous Owner | Crabb Gary S | $103,700 | |
| Previous Owner | Crabb Gary S | $89,600 | |
| Previous Owner | Crabb Gary S | $98,400 |
Source: Public Records
Tax History Compared to Growth
Tax History
| Year | Tax Paid | Tax Assessment Tax Assessment Total Assessment is a certain percentage of the fair market value that is determined by local assessors to be the total taxable value of land and additions on the property. | Land | Improvement |
|---|---|---|---|---|
| 2025 | $9,082 | $580,300 | $269,800 | $310,500 |
| 2024 | $8,644 | $572,100 | $269,800 | $302,300 |
| 2023 | $8,327 | $509,600 | $259,200 | $250,400 |
| 2022 | $8,321 | $465,400 | $234,000 | $231,400 |
| 2021 | $8,123 | $463,900 | $234,000 | $229,900 |
| 2020 | $8,327 | $490,400 | $231,900 | $258,500 |
| 2019 | $7,915 | $480,300 | $225,200 | $255,100 |
| 2018 | $7,260 | $447,600 | $212,400 | $235,200 |
| 2017 | $7,047 | $419,200 | $198,500 | $220,700 |
| 2016 | $6,909 | $400,500 | $182,200 | $218,300 |
| 2015 | $6,527 | $381,900 | $173,500 | $208,400 |
| 2014 | $6,288 | $361,400 | $177,300 | $184,100 |
Source: Public Records
Map
Nearby Homes