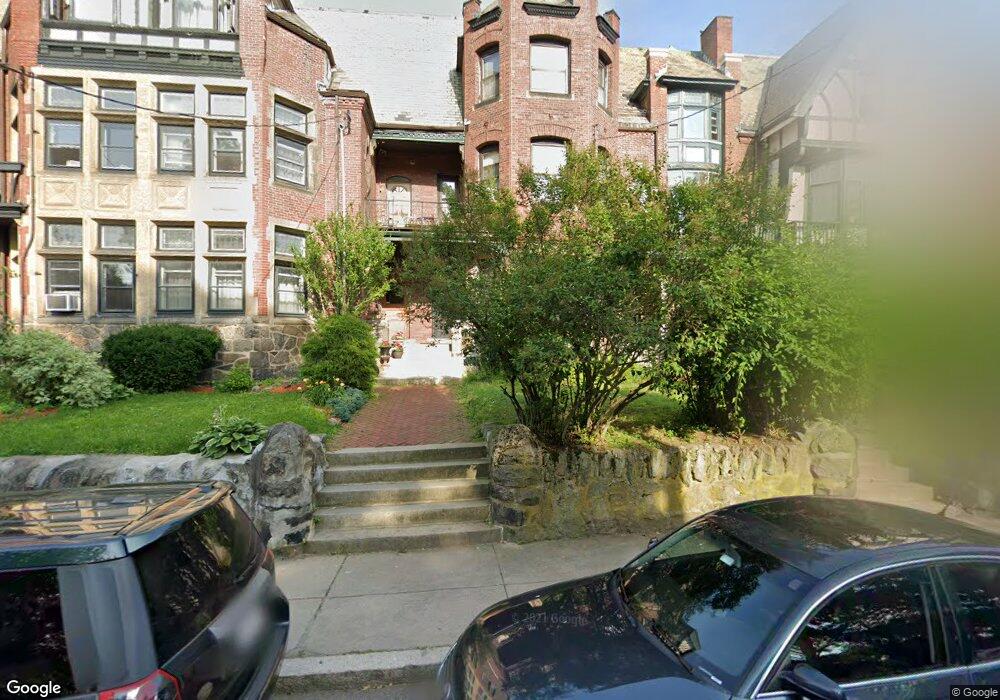
70 Harold St Roxbury, MA 02119
Washington Park NeighborhoodEstimated Value: $907,000 - $1,070,000
5
Beds
4
Baths
3,159
Sq Ft
$306/Sq Ft
Est. Value
About This Home
This home is located at 70 Harold St, Roxbury, MA 02119 and is currently estimated at $966,842, approximately $306 per square foot. 70 Harold St is a home located in Suffolk County with nearby schools including Bridge Boston Charter School and City on a Hill Charter Public School.
Ownership History
Date
Name
Owned For
Owner Type
Purchase Details
Closed on
Nov 23, 1993
Sold by
Miller John Est
Bought by
Miller Karen E
Current Estimated Value
Home Financials for this Owner
Home Financials are based on the most recent Mortgage that was taken out on this home.
Original Mortgage
$200,000
Interest Rate
6.77%
Mortgage Type
Purchase Money Mortgage
Create a Home Valuation Report for This Property
The Home Valuation Report is an in-depth analysis detailing your home's value as well as a comparison with similar homes in the area
Home Values in the Area
Average Home Value in this Area
Purchase History
| Date | Buyer | Sale Price | Title Company |
|---|---|---|---|
| Miller Karen E | $143,500 | -- |
Source: Public Records
Mortgage History
| Date | Status | Borrower | Loan Amount |
|---|---|---|---|
| Open | Miller Karen E | $178,520 | |
| Closed | Miller Karen E | $50,000 | |
| Closed | Miller Karen E | $200,000 | |
| Closed | Miller Karen E | $200,000 |
Source: Public Records
Tax History
| Year | Tax Paid | Tax Assessment Tax Assessment Total Assessment is a certain percentage of the fair market value that is determined by local assessors to be the total taxable value of land and additions on the property. | Land | Improvement |
|---|---|---|---|---|
| 2025 | $8,181 | $706,500 | $198,700 | $507,800 |
| 2024 | $6,443 | $591,100 | $148,400 | $442,700 |
| 2023 | $6,348 | $591,100 | $148,400 | $442,700 |
| 2022 | $6,012 | $552,600 | $138,700 | $413,900 |
| 2021 | $5,780 | $541,700 | $136,000 | $405,700 |
| 2020 | $4,792 | $453,800 | $124,600 | $329,200 |
| 2019 | $4,469 | $424,000 | $103,600 | $320,400 |
| 2018 | $4,151 | $396,100 | $103,600 | $292,500 |
| 2017 | $4,195 | $396,100 | $103,600 | $292,500 |
| 2016 | $4,149 | $377,200 | $103,600 | $273,600 |
| 2015 | $4,661 | $384,900 | $71,700 | $313,200 |
| 2014 | $4,560 | $362,489 | $69,549 | $292,940 |
Source: Public Records
Map
Nearby Homes
- 85 Munroe St
- 151 Townsend St Unit 1
- 151 Townsend St Unit 3
- 151 Townsend St
- 151 Townsend St Unit 2
- 150 Walnut Ave
- 16 Mayfair St
- 71 Townsend St
- 8 Humboldt Ave Unit 2
- 2856 Washington St
- 70 Rockland St
- 5 Valentine St Unit 1
- 162 Humboldt Ave
- 15 Maywood St
- 17 Maywood St
- 187 Highland St
- 16 Hawthorne St
- 12 Weldon St
- 8 Weldon St
- 35-37 Notre Dame St
Your Personal Tour Guide
Ask me questions while you tour the home.