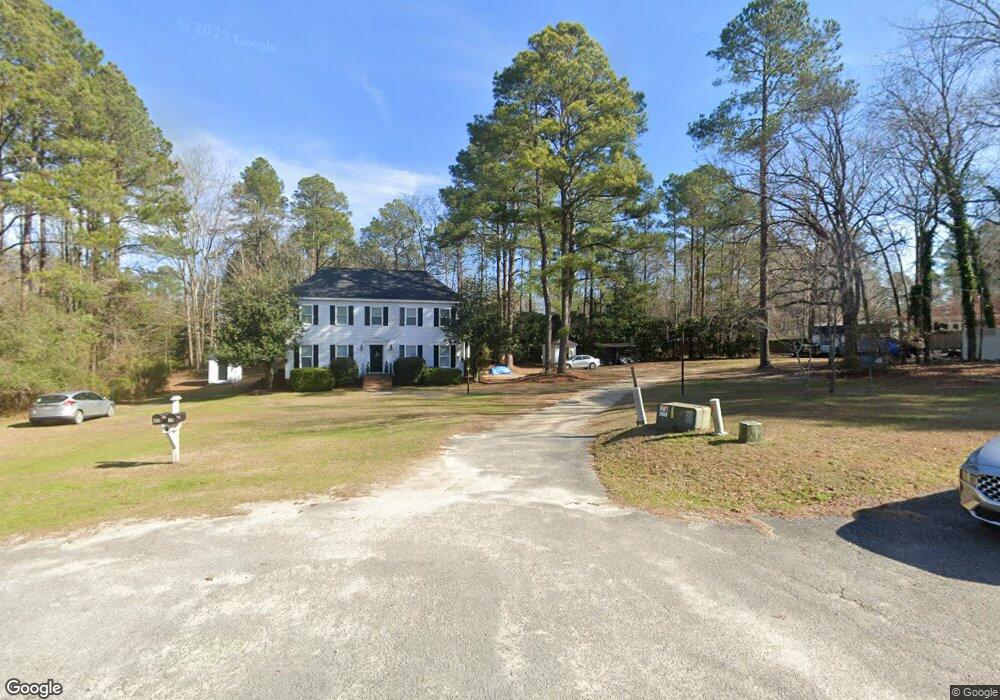
70 Hunters Path Rd Santee, SC 29142
Estimated Value: $256,000 - $384,000
5
Beds
4
Baths
2,822
Sq Ft
$110/Sq Ft
Est. Value
About This Home
This home is located at 70 Hunters Path Rd, Santee, SC 29142 and is currently estimated at $310,196, approximately $109 per square foot. 70 Hunters Path Rd is a home located in Orangeburg County with nearby schools including Elloree Elementary and Lake Marion High School.
Ownership History
Date
Name
Owned For
Owner Type
Purchase Details
Closed on
May 19, 2021
Sold by
Moorer Britton D
Bought by
Jackson Juvonda
Current Estimated Value
Home Financials for this Owner
Home Financials are based on the most recent Mortgage that was taken out on this home.
Original Mortgage
$173,280
Outstanding Balance
$157,035
Interest Rate
3.1%
Mortgage Type
FHA
Estimated Equity
$153,161
Purchase Details
Closed on
Apr 22, 2016
Sold by
Farmers & Merchants Bank Of South Caroli
Bought by
Moorer Britton D
Purchase Details
Closed on
Oct 14, 2014
Sold by
Pifer Kenneth L and Pifer Kenneth L
Bought by
Farmers & Merchants Bank Of South Caroli
Purchase Details
Closed on
Apr 27, 2007
Sold by
Pifer Michael C
Bought by
Pifer Ii Kenneth L
Purchase Details
Closed on
Jan 1, 2003
Sold by
Jones Henry A and Dayle Bolen T
Bought by
Pifer Michael C
Create a Home Valuation Report for This Property
The Home Valuation Report is an in-depth analysis detailing your home's value as well as a comparison with similar homes in the area
Purchase History
| Date | Buyer | Sale Price | Title Company |
|---|---|---|---|
| Jackson Juvonda | $176,500 | None Available | |
| Moorer Britton D | $80,000 | None Available | |
| Farmers & Merchants Bank Of South Caroli | $70,000 | -- | |
| Pifer Ii Kenneth L | $90,634 | None Available | |
| Pifer Michael C | $130,000 | -- |
Source: Public Records
Mortgage History
| Date | Status | Borrower | Loan Amount |
|---|---|---|---|
| Open | Jackson Juvonda | $173,280 |
Source: Public Records
Tax History
| Year | Tax Paid | Tax Assessment Tax Assessment Total Assessment is a certain percentage of the fair market value that is determined by local assessors to be the total taxable value of land and additions on the property. | Land | Improvement |
|---|---|---|---|---|
| 2024 | $1,465 | $7,630 | $832 | $6,798 |
| 2023 | $1,371 | $7,000 | $836 | $6,164 |
| 2022 | $1,336 | $7,000 | $836 | $6,164 |
| 2021 | $3,836 | $9,437 | $1,253 | $8,184 |
| 2020 | $3,534 | $9,437 | $0 | $0 |
| 2019 | $3,421 | $9,437 | $0 | $0 |
| 2018 | $3,757 | $9,194 | $0 | $0 |
| 2017 | $3,738 | $9,194 | $0 | $0 |
| 2016 | $1,233 | $9,194 | $0 | $0 |
| 2015 | $1,184 | $9,194 | $0 | $0 |
| 2014 | $1,184 | $6,130 | $686 | $5,444 |
| 2013 | -- | $6,710 | $686 | $6,024 |
Source: Public Records
Map
Nearby Homes
- 20 Thunder Cir
- 209 Partridge Run Rd
- 0 Sorin Cir
- 138 Twisted Oak Trail
- 147 Twisted Oak Trail
- 119 Twisted Oak Trail
- 30 Poplar Creek Dr
- 0 Poplar Creek Dr Unit 25028030
- 1621 Old River Rd
- 756 Santee River Rd
- 230 Oak Hollow Dr
- 1595 Old River Rd
- 0 Breezewood Unit 615215
- 0 Breezewood Unit 25015998
- 0 Old River Rd
- 49 Poplar Landing Ln
- 0 State Dr Unit 25027243
- 1 Acorn Ln Unit A
- 0 A Acorn Ln
- 0 B Acorn Ln
- 70 Hunters Path Rd
- 70 Hunters Path
- 50 Hunters Path Rd
- 50 Hunters Path
- 50 Hunters Path Rd
- 210 Pinewood Dr
- 1050 Moultrie Dr
- 10025 Marion Dr
- 1064 Moultrie Dr
- 10015 Marion Dr
- 20 Hunters Path Rd
- 120 Hunters Path Rd
- 10 Hunter's Path
- 40 Hunters Path Rd
- 1055 Moultrie Dr
- TBD Moultrie & Pinewood St
- Tbd Corner of Cleveland & Dantzler St
- 1080 Moultrie Dr
- 203 Pinewood Dr
- Lot 1 Cleveland St & Marion Dr
Your Personal Tour Guide
Ask me questions while you tour the home.