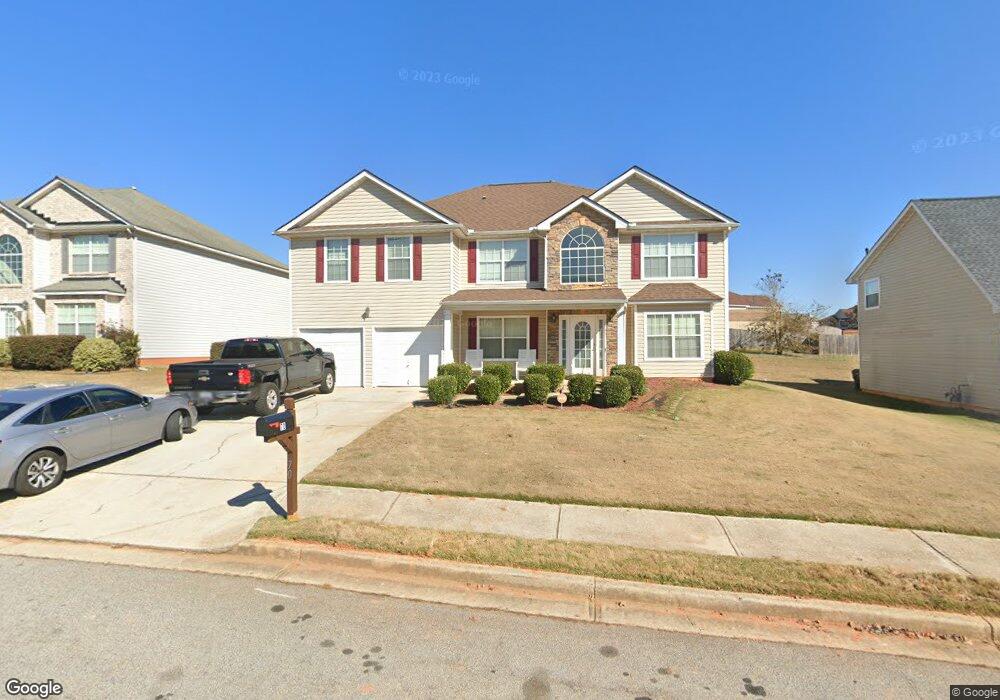
70 Lakeview Crossing Dr Covington, GA 30016
Estimated Value: $369,000 - $412,000
6
Beds
4
Baths
3,650
Sq Ft
$106/Sq Ft
Est. Value
About This Home
This home is located at 70 Lakeview Crossing Dr, Covington, GA 30016 and is currently estimated at $388,513, approximately $106 per square foot. 70 Lakeview Crossing Dr is a home located in Newton County with nearby schools including Live Oak Elementary School, Clements Middle School, and Newton High School.
Ownership History
Date
Name
Owned For
Owner Type
Purchase Details
Closed on
Oct 27, 2011
Sold by
Secretary Of Housing And U
Bought by
Richardson Tarasita
Current Estimated Value
Home Financials for this Owner
Home Financials are based on the most recent Mortgage that was taken out on this home.
Original Mortgage
$103,656
Outstanding Balance
$71,792
Interest Rate
4.5%
Mortgage Type
FHA
Estimated Equity
$316,721
Purchase Details
Closed on
Jan 4, 2011
Sold by
Suntrust Mtg Inc
Bought by
Hud-Housing Of Urban Dev
Purchase Details
Closed on
Jul 28, 2006
Sold by
Legacy Communities Of Oakwood
Bought by
Johnson Rhonda
Home Financials for this Owner
Home Financials are based on the most recent Mortgage that was taken out on this home.
Original Mortgage
$206,700
Interest Rate
6.68%
Mortgage Type
FHA
Create a Home Valuation Report for This Property
The Home Valuation Report is an in-depth analysis detailing your home's value as well as a comparison with similar homes in the area
Home Values in the Area
Average Home Value in this Area
Purchase History
| Date | Buyer | Sale Price | Title Company |
|---|---|---|---|
| Richardson Tarasita | $98,000 | -- | |
| Hud-Housing Of Urban Dev | -- | -- | |
| Suntrust Mtg Inc | $240,259 | -- | |
| Johnson Rhonda | $208,400 | -- |
Source: Public Records
Mortgage History
| Date | Status | Borrower | Loan Amount |
|---|---|---|---|
| Open | Richardson Tarasita | $103,656 | |
| Previous Owner | Johnson Rhonda | $206,700 |
Source: Public Records
Tax History Compared to Growth
Tax History
| Year | Tax Paid | Tax Assessment Tax Assessment Total Assessment is a certain percentage of the fair market value that is determined by local assessors to be the total taxable value of land and additions on the property. | Land | Improvement |
|---|---|---|---|---|
| 2024 | $3,381 | $135,440 | $20,000 | $115,440 |
| 2023 | $3,409 | $127,720 | $8,000 | $119,720 |
| 2022 | $2,735 | $102,880 | $8,000 | $94,880 |
| 2021 | $2,691 | $91,040 | $8,000 | $83,040 |
| 2020 | $2,657 | $81,600 | $8,000 | $73,600 |
| 2019 | $2,622 | $79,400 | $8,000 | $71,400 |
| 2018 | $2,413 | $72,840 | $10,800 | $62,040 |
| 2017 | $2,431 | $73,360 | $10,800 | $62,560 |
| 2016 | $2,349 | $70,960 | $8,400 | $62,560 |
| 2015 | $1,935 | $58,920 | $8,400 | $50,520 |
| 2014 | $1,737 | $53,280 | $0 | $0 |
Source: Public Records
Map
Nearby Homes
- 155 Oak Terrace Dr
- 50 Village Walk
- 40 Oakwood Dr
- 814 Jack Neely Rd
- 60 Brookstone Ct
- 90 Brookstone Ct
- 130 Stephanie Ln Unit 5
- 185 Stephanie Ln
- 65 Westover Place Unit 1
- 1136 Jack Neely Rd
- 11637 Brown Bridge Rd
- 30 Capeton Ct
- 40 Cindy Cir
- 85 Georgia Rd
- 115 Tanners Ct
- 11889 Brown Bridge Rd
- 200 Syracuse Ln
- 0 Crowell Rd Unit 10620922
- 0 Crowell Rd Unit 7662435
- 0 Crowell Rd Unit 24687706
- 60 Lakeview Crossing Dr
- 60 Lakeview Crossing Dr Unit 1
- 130 Oak Manor Dr
- 50 Lakeview Crossing Dr
- 205 Hillside Oak Ln
- 140 Oak Manor Dr Unit 1
- 75 Lakeview Crossing Dr
- 195 Hillside Oak Ln
- 100 Oak Manor Dr
- 65 Lakeview Crossing Dr
- 0 Oak Manor Dr Unit 7440110
- 0 Oak Manor Dr Unit 7529141
- 0 Oak Manor Dr Unit 7106381
- 0 Oak Manor Dr Unit 8098571
- 0 Oak Manor Dr Unit 8128750
- 0 Oak Manor Dr Unit 8182919
- 0 Oak Manor Dr
- 40 Lakeview Crossing Dr
- 135 Oak Manor Dr Unit 1
- 115 Oak Manor Dr