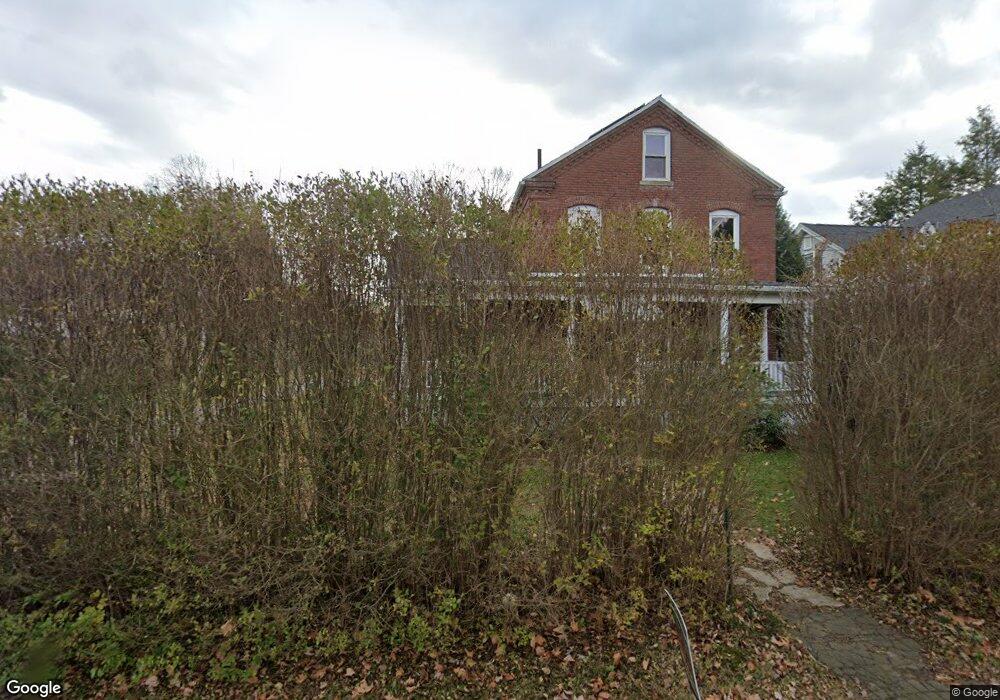
70 Maple St Unit 72 Easthampton, MA 01027
Estimated Value: $349,000 - $470,000
3
Beds
2
Baths
1,752
Sq Ft
$229/Sq Ft
Est. Value
About This Home
This home is located at 70 Maple St Unit 72, Easthampton, MA 01027 and is currently estimated at $400,395, approximately $228 per square foot. 70 Maple St Unit 72 is a home located in Hampshire County with nearby schools including Easthampton High School, Tri-County Schools, and New England Adolescent Research Institute.
Ownership History
Date
Name
Owned For
Owner Type
Purchase Details
Closed on
Dec 12, 2016
Sold by
Penney Laura R and Penney Marcia L
Bought by
Penney Laura R and Edwards Robert A
Current Estimated Value
Purchase Details
Closed on
Sep 20, 2013
Sold by
Baer Steven R and Baer Debra J
Bought by
Penney Laura R and Penney Marcia L
Home Financials for this Owner
Home Financials are based on the most recent Mortgage that was taken out on this home.
Original Mortgage
$173,600
Interest Rate
4.42%
Mortgage Type
New Conventional
Purchase Details
Closed on
Aug 14, 2006
Sold by
Lech Michael D and Lech Stanley F
Bought by
Baer Steven R
Home Financials for this Owner
Home Financials are based on the most recent Mortgage that was taken out on this home.
Original Mortgage
$153,600
Interest Rate
6.8%
Mortgage Type
Purchase Money Mortgage
Purchase Details
Closed on
Jul 23, 2003
Sold by
Lech Lottie T
Bought by
Lech Michael D and Lech Stanley F
Create a Home Valuation Report for This Property
The Home Valuation Report is an in-depth analysis detailing your home's value as well as a comparison with similar homes in the area
Home Values in the Area
Average Home Value in this Area
Purchase History
| Date | Buyer | Sale Price | Title Company |
|---|---|---|---|
| Penney Laura R | -- | -- | |
| Penney Laura R | $220,000 | -- | |
| Penney Laura R | $220,000 | -- | |
| Baer Steven R | $192,000 | -- | |
| Lech Michael D | -- | -- |
Source: Public Records
Mortgage History
| Date | Status | Borrower | Loan Amount |
|---|---|---|---|
| Previous Owner | Penney Laura R | $173,600 | |
| Previous Owner | Baer Steven R | $153,600 |
Source: Public Records
Tax History
| Year | Tax Paid | Tax Assessment Tax Assessment Total Assessment is a certain percentage of the fair market value that is determined by local assessors to be the total taxable value of land and additions on the property. | Land | Improvement |
|---|---|---|---|---|
| 2025 | $4,462 | $326,400 | $113,300 | $213,100 |
| 2024 | $4,301 | $317,200 | $110,000 | $207,200 |
| 2023 | $3,245 | $221,500 | $86,900 | $134,600 |
| 2022 | $3,661 | $221,500 | $86,900 | $134,600 |
| 2021 | $4,531 | $224,500 | $86,900 | $137,600 |
| 2020 | $3,934 | $221,500 | $86,900 | $134,600 |
| 2019 | $3,174 | $205,300 | $86,900 | $118,400 |
| 2018 | $3,112 | $194,500 | $82,000 | $112,500 |
| 2017 | $3,026 | $186,700 | $78,600 | $108,100 |
| 2016 | $2,914 | $186,900 | $78,600 | $108,300 |
| 2015 | $2,832 | $186,900 | $78,600 | $108,300 |
Source: Public Records
Map
Nearby Homes
- 2 Oak St
- 40 Clark St
- 33 Knipfer Ave
- 4 Gaugh St
- 19 Nicols Way Unit 19
- 7 Union Ct
- 12 Glen Cove Place Unit B
- 10 Glen Cove Place Unit A
- 18-20 Oakdale Place
- 11 Dragon Cir
- 6 Wilton Rd
- 41 South St Unit 11
- 336 Main St
- 385 Main St
- 6 S St & Abutting Lots
- 211 East St Unit 11
- M143 &152 Glendale St
- 2 W Park Dr
- 36 & 36R Holly Cir
- 131 West St Unit 131
Your Personal Tour Guide
Ask me questions while you tour the home.