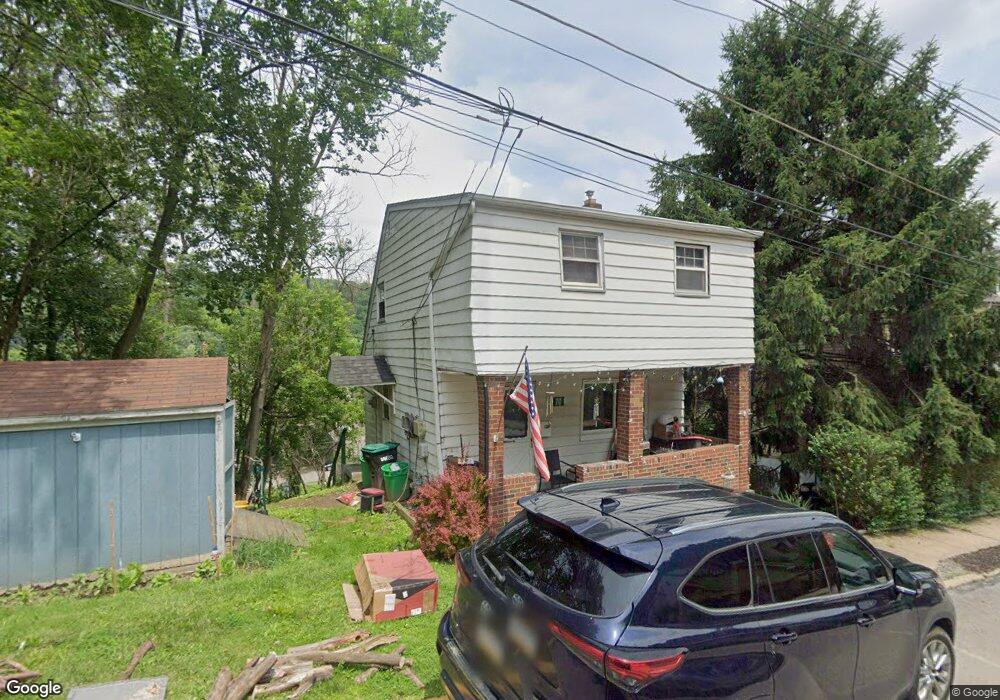
70 Maplewood St Pittsburgh, PA 15223
Estimated Value: $135,000 - $186,000
2
Beds
1
Bath
1,120
Sq Ft
$145/Sq Ft
Est. Value
About This Home
This home is located at 70 Maplewood St, Pittsburgh, PA 15223 and is currently estimated at $162,060, approximately $144 per square foot. 70 Maplewood St is a home located in Allegheny County with nearby schools including Marzolf Primary School, Shaler Area Elementary School, and Shaler Area Middle School.
Ownership History
Date
Name
Owned For
Owner Type
Purchase Details
Closed on
Apr 27, 2007
Sold by
Palajsa Carol A
Bought by
Henson James A
Current Estimated Value
Home Financials for this Owner
Home Financials are based on the most recent Mortgage that was taken out on this home.
Original Mortgage
$54,810
Outstanding Balance
$33,357
Interest Rate
6.18%
Mortgage Type
New Conventional
Estimated Equity
$128,703
Purchase Details
Closed on
Aug 19, 1999
Sold by
Hussey Laura L and Rotenstein David
Bought by
Palajsa Carol A
Create a Home Valuation Report for This Property
The Home Valuation Report is an in-depth analysis detailing your home's value as well as a comparison with similar homes in the area
Home Values in the Area
Average Home Value in this Area
Purchase History
| Date | Buyer | Sale Price | Title Company |
|---|---|---|---|
| Henson James A | $60,900 | -- | |
| Palajsa Carol A | $47,000 | -- |
Source: Public Records
Mortgage History
| Date | Status | Borrower | Loan Amount |
|---|---|---|---|
| Open | Henson James A | $54,810 |
Source: Public Records
Tax History Compared to Growth
Tax History
| Year | Tax Paid | Tax Assessment Tax Assessment Total Assessment is a certain percentage of the fair market value that is determined by local assessors to be the total taxable value of land and additions on the property. | Land | Improvement |
|---|---|---|---|---|
| 2025 | $1,814 | $47,200 | $17,300 | $29,900 |
| 2024 | $1,814 | $47,200 | $17,300 | $29,900 |
| 2023 | $1,759 | $47,200 | $17,300 | $29,900 |
| 2022 | $1,759 | $47,200 | $17,300 | $29,900 |
| 2021 | $223 | $47,200 | $17,300 | $29,900 |
| 2020 | $1,759 | $47,200 | $17,300 | $29,900 |
| 2019 | $1,759 | $47,200 | $17,300 | $29,900 |
| 2018 | $454 | $47,200 | $17,300 | $29,900 |
| 2017 | $1,677 | $47,200 | $17,300 | $29,900 |
| 2016 | $223 | $47,200 | $17,300 | $29,900 |
| 2015 | $223 | $47,200 | $17,300 | $29,900 |
| 2014 | $1,620 | $47,200 | $17,300 | $29,900 |
Source: Public Records
Map
Nearby Homes