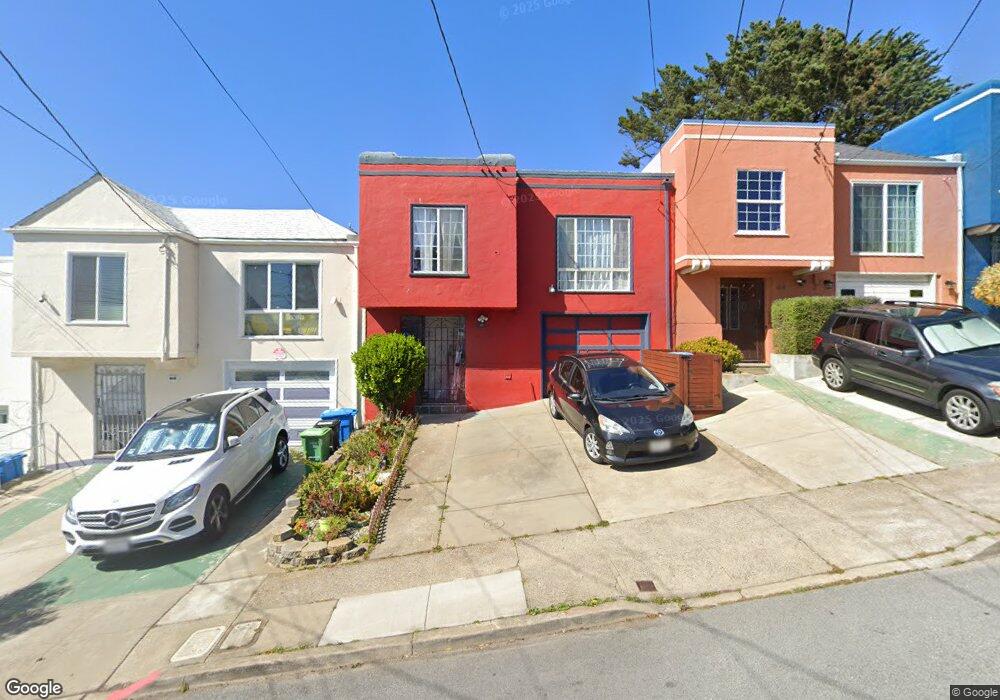
70 Montana St San Francisco, CA 94112
Oceanview NeighborhoodEstimated Value: $863,000 - $969,000
--
Bed
1
Bath
850
Sq Ft
$1,091/Sq Ft
Est. Value
About This Home
This home is located at 70 Montana St, San Francisco, CA 94112 and is currently estimated at $927,473, approximately $1,091 per square foot. 70 Montana St is a home located in San Francisco County with nearby schools including Sheridan Elementary School, Denman (James) Middle School, and Leadership High School.
Ownership History
Date
Name
Owned For
Owner Type
Purchase Details
Closed on
Jan 9, 2005
Sold by
Truong Trung The and Cheng Queenie
Bought by
Truong Trung The and Cheng Queenie
Current Estimated Value
Purchase Details
Closed on
Aug 1, 2001
Sold by
Harrison Girdenous
Bought by
Truong Trung The and Cheng Queenie
Home Financials for this Owner
Home Financials are based on the most recent Mortgage that was taken out on this home.
Original Mortgage
$260,000
Outstanding Balance
$101,715
Interest Rate
7.19%
Estimated Equity
$825,758
Create a Home Valuation Report for This Property
The Home Valuation Report is an in-depth analysis detailing your home's value as well as a comparison with similar homes in the area
Home Values in the Area
Average Home Value in this Area
Purchase History
| Date | Buyer | Sale Price | Title Company |
|---|---|---|---|
| Truong Trung The | -- | -- | |
| Truong Trung The | $340,000 | Chicago Title Co |
Source: Public Records
Mortgage History
| Date | Status | Borrower | Loan Amount |
|---|---|---|---|
| Open | Truong Trung The | $260,000 |
Source: Public Records
Tax History Compared to Growth
Tax History
| Year | Tax Paid | Tax Assessment Tax Assessment Total Assessment is a certain percentage of the fair market value that is determined by local assessors to be the total taxable value of land and additions on the property. | Land | Improvement |
|---|---|---|---|---|
| 2025 | $6,558 | $502,266 | $301,360 | $200,906 |
| 2024 | $6,558 | $492,418 | $295,451 | $196,967 |
| 2023 | $6,451 | $482,763 | $289,658 | $193,105 |
| 2022 | $6,316 | $473,298 | $283,979 | $189,319 |
| 2021 | $6,201 | $464,018 | $278,411 | $185,607 |
| 2020 | $6,294 | $459,261 | $275,557 | $183,704 |
| 2019 | $6,034 | $450,256 | $270,154 | $180,102 |
| 2018 | $5,832 | $441,428 | $264,857 | $176,571 |
| 2017 | $5,465 | $432,773 | $259,664 | $173,109 |
| 2016 | $5,355 | $424,288 | $254,573 | $169,715 |
| 2015 | $5,288 | $417,916 | $250,750 | $167,166 |
| 2014 | $5,150 | $409,731 | $245,839 | $163,892 |
Source: Public Records
Map
Nearby Homes
- 5000 Summit St
- 34 Brighton Ave
- 63 Minerva St
- 171 Margaret Ave
- 914 Capitol Ave
- 946 Capitol Ave
- 106 Broad St
- 615 Mount Vernon Ave
- 324 Holloway Ave
- 20 Sargent St
- 2921 Alemany Blvd
- 271 Granada Ave
- 841 Ocean Ave
- 275 Miramar Ave
- 115 Ottawa Ave
- 900 Huron Ave
- 475 Head St
- 224 Shields St
- 233 Sargent St
- 108 Naglee Ave