
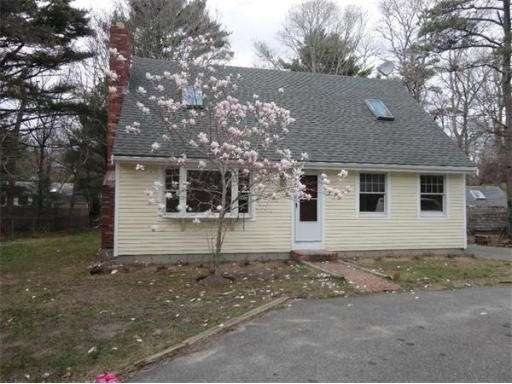
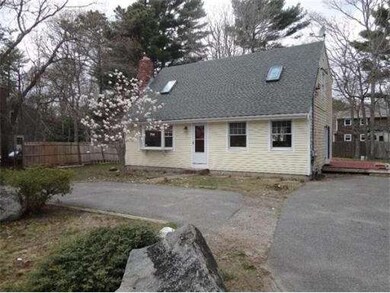
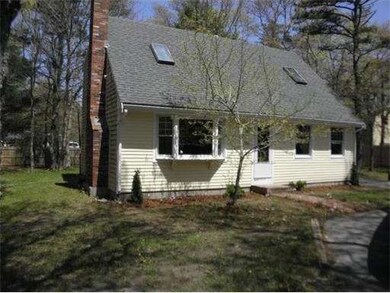

70 Quinaquisset Ave Mashpee, MA 02649
3
Beds
2
Baths
1,428
Sq Ft
0.29
Acres
About This Home
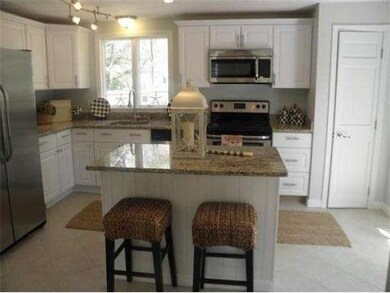
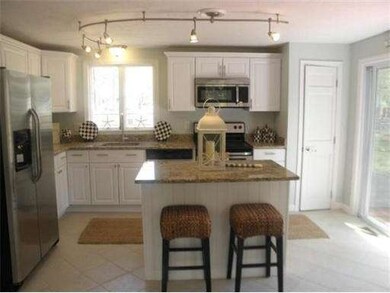
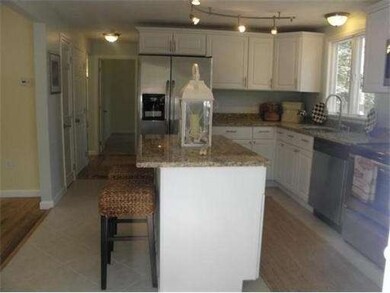
As of April 2021Newly renovated 3 bedroom 2 bath cape with hardwood floors, beautiful granite/stainless kitchen, fireplace living room, gas heat w/ NEW heating system AND Central A/C, partially finished basement and spacious yard with fire pit! This home is immaculate and a MUST see! This home would make a great year round residence OR a Summer / Yearly rental! **100% Financing Available!!! Own this home for less than it would cost to rent it with NO MONEY DOWN!!!**
Last Agent to Sell the Property
RE/MAX Real Estate Center Listed on: 05/23/2014
Home Details
Home Type
Single Family
Est. Annual Taxes
$3,433
Year Built
1985
Lot Details
0
Listing Details
- Lot Description: Cleared
- Special Features: None
- Property Sub Type: Detached
- Year Built: 1985
Interior Features
- Has Basement: Yes
- Fireplaces: 1
- Number of Rooms: 6
- Energy: Storm Windows
- Flooring: Tile, Hardwood
- Basement: Full, Finished, Interior Access, Bulkhead
Exterior Features
- Construction: Frame
- Exterior: Shingles
- Exterior Features: Deck, Storage Shed
- Foundation: Poured Concrete
Garage/Parking
- Parking Spaces: 5
Utilities
- Hot Water: Tank
Condo/Co-op/Association
- HOA: Unknown
Ownership History
Date
Name
Owned For
Owner Type
Purchase Details
Listed on
Mar 2, 2021
Closed on
Apr 30, 2021
Sold by
Barss Gail A
Bought by
Curran John J
Seller's Agent
Team Martin Lapsley
Kinlin Grover Real Estate
Buyer's Agent
Patty Connolly
William Raveis Real Estate & Home Services
List Price
$425,000
Sold Price
$450,000
Premium/Discount to List
$25,000
5.88%
Total Days on Market
95
Current Estimated Value
Home Financials for this Owner
Home Financials are based on the most recent Mortgage that was taken out on this home.
Estimated Appreciation
$180,347
Avg. Annual Appreciation
7.76%
Original Mortgage
$441,849
Outstanding Balance
$401,520
Interest Rate
3%
Mortgage Type
FHA
Estimated Equity
$217,141
Purchase Details
Listed on
May 23, 2014
Closed on
Sep 12, 2014
Sold by
Pensco T Co Llc
Bought by
Barss Gail A
Seller's Agent
Melissa Morris Uhlman
RE/MAX Real Estate Center
Buyer's Agent
Sarah Lapsley
Greer Real Estate, LLC
List Price
$279,000
Sold Price
$262,000
Premium/Discount to List
-$17,000
-6.09%
Home Financials for this Owner
Home Financials are based on the most recent Mortgage that was taken out on this home.
Avg. Annual Appreciation
8.50%
Purchase Details
Listed on
Jul 18, 2013
Closed on
Mar 28, 2014
Sold by
Fnma
Bought by
Ira Jeffrey J Kobold and Pensco T Co Llc
Seller's Agent
Team 300
Today Real Estate
Buyer's Agent
Melissa Uhlman
RE/MAX Spectrum of Osterville (INACTIVE)
List Price
$249,900
Sold Price
$175,000
Premium/Discount to List
-$74,900
-29.97%
Home Financials for this Owner
Home Financials are based on the most recent Mortgage that was taken out on this home.
Avg. Annual Appreciation
140.44%
Purchase Details
Closed on
Jun 13, 2013
Sold by
Davis Nathaniel W and Citimortgage Inc
Bought by
Fnma
Purchase Details
Closed on
Oct 25, 2002
Sold by
Myers Matthew T and Myers Kristin J
Bought by
Davis Nathaniel W
Home Financials for this Owner
Home Financials are based on the most recent Mortgage that was taken out on this home.
Original Mortgage
$194,750
Interest Rate
6.2%
Mortgage Type
Purchase Money Mortgage
Purchase Details
Closed on
Jan 15, 1998
Sold by
Clarke Christopher C
Bought by
Myers Matthew T and Myers Kristin J
Purchase Details
Closed on
Jan 26, 1995
Sold by
Citizens Bk Of Ma
Bought by
Clarke Christopher C
Purchase Details
Closed on
Apr 4, 1994
Sold by
Ciccone John R
Bought by
Citizens Bk Of Ma
Similar Home in Mashpee, MA
Create a Home Valuation Report for This Property
The Home Valuation Report is an in-depth analysis detailing your home's value as well as a comparison with similar homes in the area
Home Values in the Area
Average Home Value in this Area
Purchase History
| Date | Type | Sale Price | Title Company |
|---|---|---|---|
| Not Resolvable | $450,000 | None Available | |
| Not Resolvable | $262,000 | -- | |
| Warranty Deed | $175,000 | -- | |
| Foreclosure Deed | $194,767 | -- | |
| Deed | $205,000 | -- | |
| Deed | $83,500 | -- | |
| Deed | $81,000 | -- | |
| Foreclosure Deed | $81,000 | -- |
Source: Public Records
Mortgage History
| Date | Status | Loan Amount | Loan Type |
|---|---|---|---|
| Open | $441,849 | FHA | |
| Previous Owner | $196,000 | No Value Available | |
| Previous Owner | $194,750 | Purchase Money Mortgage | |
| Previous Owner | $118,000 | No Value Available |
Source: Public Records
Property History
| Date | Event | Price | Change | Sq Ft Price |
|---|---|---|---|---|
| 04/30/2021 04/30/21 | Sold | $450,000 | +5.9% | $315 / Sq Ft |
| 03/09/2021 03/09/21 | Pending | -- | -- | -- |
| 03/02/2021 03/02/21 | For Sale | $425,000 | +62.2% | $298 / Sq Ft |
| 09/15/2014 09/15/14 | Sold | $262,000 | 0.0% | $183 / Sq Ft |
| 09/12/2014 09/12/14 | Sold | $262,000 | -2.6% | $183 / Sq Ft |
| 09/02/2014 09/02/14 | Pending | -- | -- | -- |
| 08/26/2014 08/26/14 | Pending | -- | -- | -- |
| 07/30/2014 07/30/14 | Price Changed | $269,000 | -1.3% | $188 / Sq Ft |
| 07/23/2014 07/23/14 | Price Changed | $272,500 | -0.5% | $191 / Sq Ft |
| 07/14/2014 07/14/14 | Price Changed | $274,000 | -1.1% | $192 / Sq Ft |
| 06/17/2014 06/17/14 | Price Changed | $277,000 | -0.7% | $194 / Sq Ft |
| 05/23/2014 05/23/14 | For Sale | $279,000 | -2.1% | $195 / Sq Ft |
| 05/06/2014 05/06/14 | For Sale | $285,000 | +62.9% | $200 / Sq Ft |
| 03/28/2014 03/28/14 | Sold | $175,000 | -30.0% | $123 / Sq Ft |
| 03/07/2014 03/07/14 | Pending | -- | -- | -- |
| 07/18/2013 07/18/13 | For Sale | $249,900 | -- | $175 / Sq Ft |
Source: MLS Property Information Network (MLS PIN)
Tax History Compared to Growth
Tax History
| Year | Tax Paid | Tax Assessment Tax Assessment Total Assessment is a certain percentage of the fair market value that is determined by local assessors to be the total taxable value of land and additions on the property. | Land | Improvement |
|---|---|---|---|---|
| 2025 | $3,433 | $518,600 | $185,500 | $333,100 |
| 2024 | $3,153 | $490,400 | $168,700 | $321,700 |
| 2023 | $2,955 | $421,500 | $160,600 | $260,900 |
| 2022 | $2,640 | $323,100 | $130,600 | $192,500 |
| 2021 | $2,595 | $286,100 | $117,600 | $168,500 |
| 2020 | $2,502 | $275,300 | $113,100 | $162,200 |
| 2019 | $2,386 | $263,600 | $113,100 | $150,500 |
| 2018 | $2,251 | $252,300 | $113,100 | $139,200 |
| 2017 | $2,184 | $237,700 | $113,100 | $124,600 |
| 2016 | $2,116 | $229,000 | $113,100 | $115,900 |
| 2015 | $2,042 | $224,200 | $113,100 | $111,100 |
| 2014 | $2,077 | $221,200 | $111,700 | $109,500 |
Source: Public Records
Agents Affiliated with this Home
-
T
Seller's Agent in 2021
Team Martin Lapsley
Kinlin Grover Real Estate
-
Buyer's Agent in 2021
Patty Connolly
William Raveis Real Estate & Home Services
(508) 523-8885
10 in this area
87 Total Sales
-
M
Seller's Agent in 2014
Melissa Uhlman
RE/MAX Spectrum of Osterville (INACTIVE)
-
Seller's Agent in 2014
Melissa Morris Uhlman
RE/MAX
(508) 367-5916
3 in this area
69 Total Sales
-
T
Seller's Agent in 2014
Team 300
Today Real Estate
(508) 790-2300
19 in this area
239 Total Sales
-
L
Buyer's Agent in 2014
Lapsley Martin Team
Greer Real Estate, LLC
Map
Source: MLS Property Information Network (MLS PIN)
MLS Number: 71688329
APN: MASH-000068-000062
Disclaimer: Certain information contained herein is derived from information provided by parties other than Homes.com. All information provided is deemed reliable, but is not guaranteed to be accurate and should be independently verified.
![]() The property listing data and information, or the Images, set forth herein were provided to MLS Property Information Network, Inc. from third party sources, including sellers, lessors and public records, and were compiled by MLS Property Information Network, Inc. The property listing data and information, and the Images, are for the personal, non-commercial use of consumers having a good faith interest in purchasing or leasing listed properties of the type displayed to them and may not be used for any purpose other than to identify prospective properties which such consumers may have a good faith interest in purchasing or leasing. MLS Property Information Network, Inc. and its subscribers disclaim any and all representations and warranties as to the accuracy of the property listing data and information, or as to the accuracy of any of the Images, set forth herein.
The property listing data and information, or the Images, set forth herein were provided to MLS Property Information Network, Inc. from third party sources, including sellers, lessors and public records, and were compiled by MLS Property Information Network, Inc. The property listing data and information, and the Images, are for the personal, non-commercial use of consumers having a good faith interest in purchasing or leasing listed properties of the type displayed to them and may not be used for any purpose other than to identify prospective properties which such consumers may have a good faith interest in purchasing or leasing. MLS Property Information Network, Inc. and its subscribers disclaim any and all representations and warranties as to the accuracy of the property listing data and information, or as to the accuracy of any of the Images, set forth herein.
Nearby Homes
- 83 Brewster Rd
- 300 Falmouth Rd Unit 12A
- 300 Falmouth Rd Unit 7E
- 300 Falmouth Rd Unit 21E
- 37 Ships Rudder Dr
- 14 Willow Cir
- 6 Willow Cir
- 71 Blue Spruce Way
- 71 Blue Spruce Way Unit 71
- 59 Eagle Dr
- 44 The Heights
- 38 Gold Leaf Ln
- 12 Red Cedar Rd
- 9 Red Cedar Rd
- 160 Mashpee Neck Rd
- 66 Simons Rd Unit A
- 66 Simons Rd Unit C
- 77 The Heights